This handbook provides a comprehensive guide to modern techniques in measuring the natural environment, including water quality, hydrology, weather, and soil. It focuses on environmental monitoring and data collection, including sensors, remote data acquisition systems, and cloud-based data management. Its aim is to be a practical resource for environmental professionals, researchers, and students to quickly locate […]
Read More →
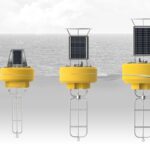
NexSens custom buoy configurations offer a robust, reliable, flexible platform for placing user-supplied sensing electronics in the water.
Read More →
Using the GLOS API option in the Data Export tool, users can share their project data directly with the Great Lakes Observing System (GLOS) in the format recognized by GLOS. Saving/memorizing a template allows WQData to send data automatically at a specified interval. General To create a Data Export with the GLOS API: Navigate […]
Read More →
The X2 is an all-in-one environmental data logger that can be controlled from any internet browser using a smartphone, tablet, or PC. It automatically recognizes sensors and sends data to the WQData LIVE web data center via Wi-Fi, cellular, radio, or satellite telemetry. There, data is presented on a fully-featured and easy-to-use dashboard where remote, […]
Read More →
The Data Export feature is a quick and simple data acquisition tool that allows users to download or send data through email or FTP in CSV or multiple XML formats without loading data directly onto the WQData LIVE page. This feature removes the latency associated with loading a substantial data set. To access the […]
Read More →
The log start time and selective upload interval(s) can be set through the Advanced Device Remote Configuration tool. These features allow the X2 to log data to its internal memory at a specific log start time and control the transmission of certain parameters. These features help reduce system data usage and telemetry on-time. Adjust […]
Read More →
The Advanced Device Remote Configuration tool allows the user to adjust the following: Update data logger settings Set the log and transmit start times Change which parameters are logged and transmitted Change the data logger transmission settings To access the tool: Navigate to the ADMIN | Settings tab found at the top of the project Dashboard. […]
Read More →
Averaging for sensor parameters may be enabled by adjusting the log and sample intervals in the Device Remote Configuration Tool within the administrator settings. Log Interval: Frequency of data written to the data logger memory to be transmitted to the web. Sample Interval: Frequency of data read from the sensor by the data logger internally. […]
Read More →
The Device Remote Configuration Tool allows remote configuration of the following: Change sensor logging and transmit intervals Configure event based transmissions for G2 and V2 systems Choose which parameters are logged and transmitted to the web Configure parameter offsets Name a data logger Run a sensor detection Sync X2 data logger settings To access […]
Read More →
Owners of devices on WQData LIVE may move data loggers between sites as necessary. All device information and collected data will move to the new site. Before moving a logger, it is required that the logger is removed or “unassigned” from its current site. Removing / “Unassigning” a Device To remove / “unassign” a […]
Read More →