
Dashboard Panels
A WQData LIVE Dashboard contains multiple editable and interactive panels that can be adjusted to optimize display of project information and data. These panels provide project administrators and collaborators with the following:
- Information regarding the project overview and scope
- Site information
- Device and sensor parameters and measurements
- Information regarding contributors to the project
*Note: Before continuing, ensure to review Creating a Custom Dashboard for information on the types of Dashboards, how they can be utilized, and how to incorporate new dashboard panels.
Custom Dashboard
All custom dashboards contain a drop-down list of the available panels as shown in Figure 1. The purpose of each panel and its customization options are described in the following.
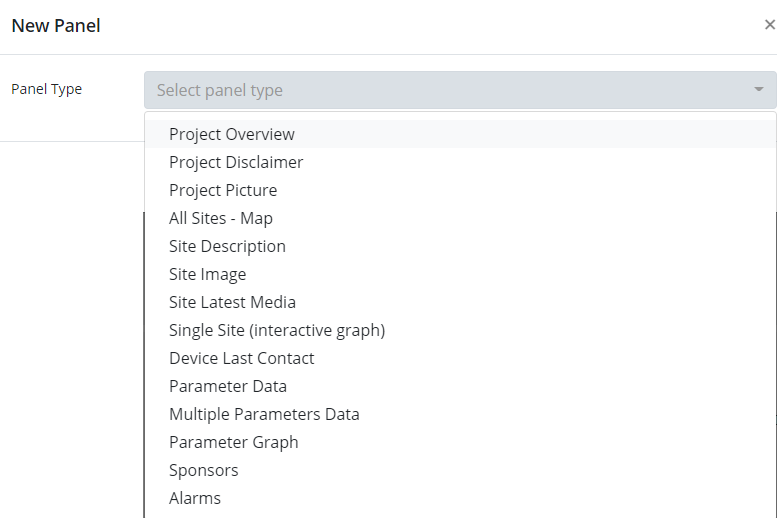
Figure 1: Custom Dashboard panel list.
- Project Overview and Disclaimer
The Project Overview and Project Disclaimer initially contain NexSens-generated messages regarding the WQData LIVE web datacenter’s purpose and disclaimer about the potential uncertainty of data associated with environmental monitoring. These messages, along with the headers, are customizable for users to explain the project scope and how data should be handled and interpreted. NexSens recommends including these messages on all dashboards to ensure any users or visitors are aware of their responsibility in properly gathering, analyzing, and drawing conclusions from the data collected on their project. Edits to these panels are possible within the ADMIN | Settings | Project/Site | Project menu.

Figure 2: Project Description panel. |

Figure 3: Project Disclaimer panel. |
- Project Picture
The Project Picture provides a visual representation of the project, whether it be the company logo, a view of the site, the environmental monitoring system set up, or another depiction characterizing the essence of the project. The Project Picture is configured in the Picture section of the ADMIN | Settings | Project/Site | Project menu.
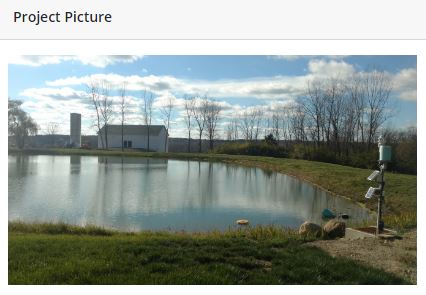
Figure 4: Project Picture panel.
- All Sites – Map
Displays the Project/Site location based on the longitude and latitude coordinates entered in ADMIN | Settings. Each logger contains an icon which, when selected, displays real-time information. This panel also includes a graph, data, and statistics representing the selected logger and parameters within the All Sites tab.

Figure 5: Interactive graph of selected data from All Sites.
- Site Description
Displays any text that is currently entered for the specified Site within the Description section of the ADMIN | Settings | Project/Site | Sites menu.
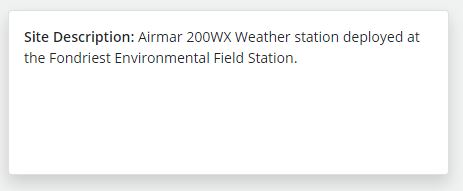
Figure 6: Site Description panel.
- Site Image
Displays the photo selected for the specified Site within the Image section of the ADMIN | Settings | Project/Site | Sites menu.
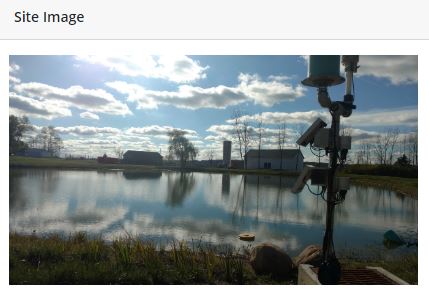
Figure 7: Site Image panel.
- Site Latest Media
Displays the latest user-uploaded or automatically imported photo in the Project/Site Gallery (ADMIN | Gallery).
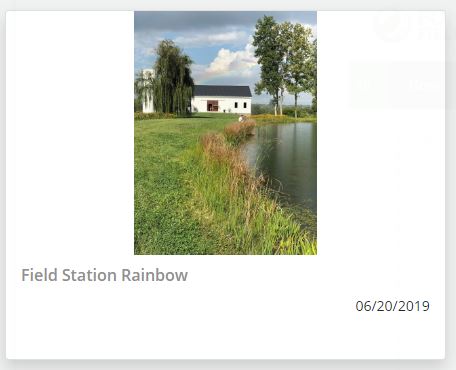
Figure 8: Site Latest Media panel.
- Single Site (interactive graph)
Displays a line graph which plots any number of the selected parameters available for a site.

Figure 9: Single Site with interactive graph panel.
- Device Last Contact
Shows the last time the selected data logger made contact with WQData LIVE (diagnostically useful).
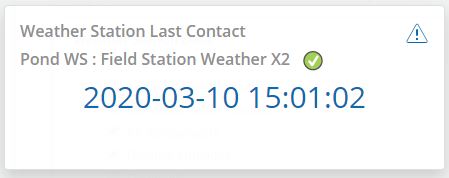
Figure 10: Device Last Contact panel.
- Parameter Data
Displays the latest reading for a specific project parameter. Additionally, the module shows a bar graph below the reading based on the sensor min and max values set under the ADMIN | Settings | Parameter Settings menu. This menu is also permits editing of display precision and unit conversion.
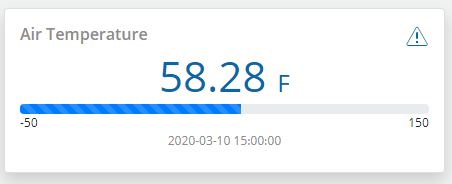
Figure 11: Parameter Data panel.
- Multiple Parameters Data
Creates a table containing the latest data points for all selected project parameters.
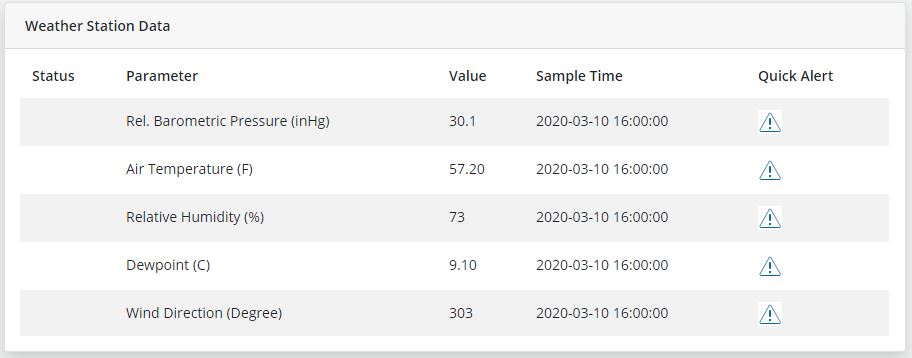
Figure 12: Multiple Parameters Data panel.
- Parameter Graph
Creates a fixed graph plotting one or more project parameters. Useful when comparing like-parameters at a glance (ex. upstream vs. downstream turbidity).

Figure 13: Parameter Graph panel.
- Sponsors
Displays the logos (and embedded website links) of project supporters. Upload logos and their associated URLs from the ADMIN | Public Portal | Sponsors menu.

Figure 14: Project Sponsors panel.
- Alarms
Displays a summary of all user-configured alerts and alarms for systems within the WQData LIVE Project.

Figure 15: Alarms panel.