
Create a Custom Dashboard
Custom WQData LIVE Dashboards are user-configurable displays to show the most important project information directly on the main screen when a Project is opened. A default Project Dashboard displays on the main screen upon Project creation. To replace with a custom Dashboard, follow the steps below.
- Navigate to the Project Dashboard drop-down menu located at the top left of the Dashboard.

Figure 1: Click Project Dashboard located at the top left of the template Dashboard.
- Select + New Dashboard.
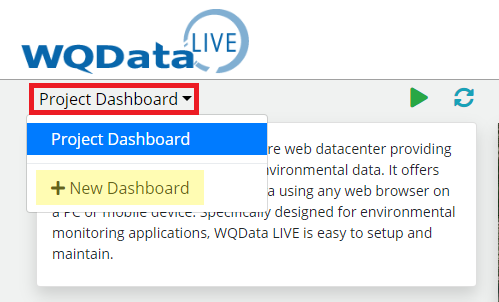
Figure 2: Click + New Dashboard.
- Assign a name to the new Dashboard and select one of the three listed starting template styles, which are described below.

Figure 3: Select Dashboard template.
Choose a Dashboard Template Style
PROJECT
The default Project Dashboard features the following:
- Satellite map showing the locations of all sites for the project.
- Site dot colors reflect the status of any active system alarms or alerts.
- An interactive line graph which displays the data from the selected parameter of a site.
- The selected parameter value also appears underneath the associated site dot on the map.
- A summary of the status of all configured alarms for a project.
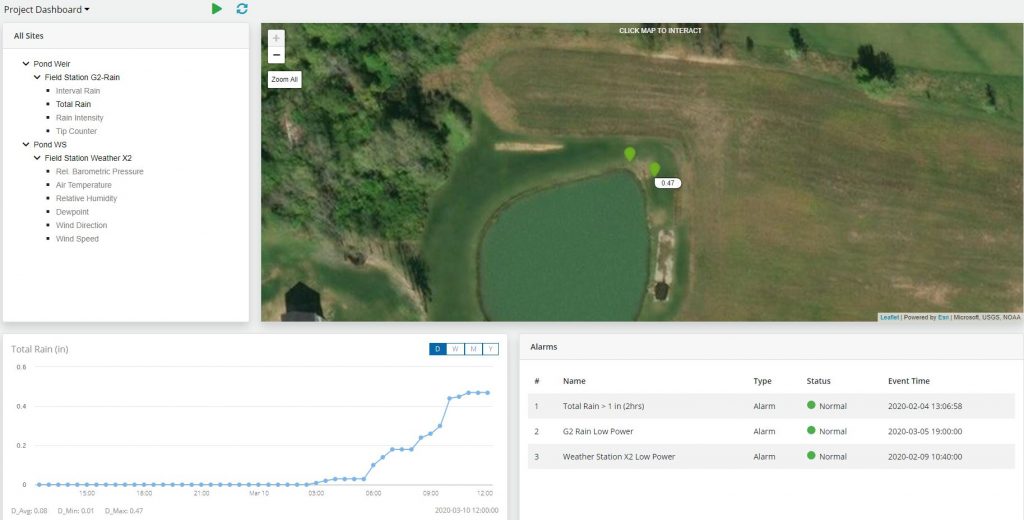
Figure 4: Project Dashboard default example.
SITE
The default Site Dashboard features the following information from the first data logger assigned to a site:
- Last device contact time marker.
- Interactive graph where multiple system parameters can be graphed.
- Individual data readouts for all parameters with a bar indicator scaled to the minimum and maximum typical values.
- A table displaying the last reported data logger diagnostic readings.
- A summary of the status of all configured alarms for a project.
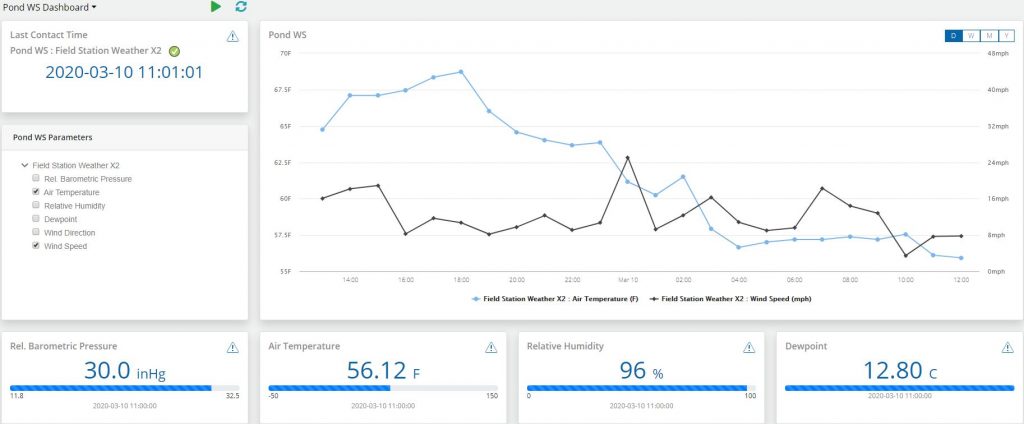
Figure 5: Site Dashboard default example (1/2).
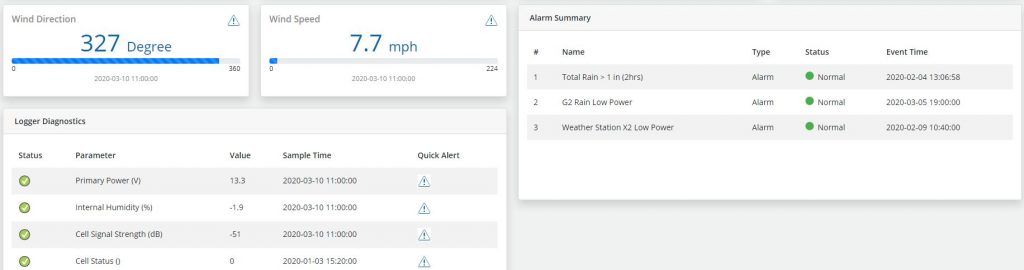
Figure 6: Site Dashboard default example (2/2).
BLANK
The Blank Dashboard has no pre-configured layout. The user can add any number and arrangement of up to (15) unique modules to show project data, images, graphs, site maps etc.
Additional details about all of the available modules can be reviewed here.
Customize a Selected Dashboard Type
- Choose the preferred template option and click Continue.
Figure 7: Select template option.
- Edit the Dashboard view as desired.
- Click on the plus (+) tile to add modules to the Dashboard.
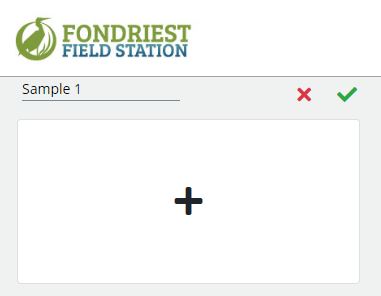
Figure 8: Click the tile to add a new module.
-
- Select the RED trashcan icon to remove any undesired modules or the BLUE pencil icon to edit an existing module.
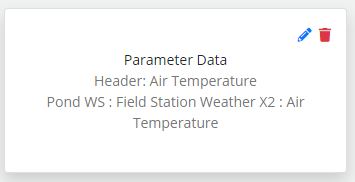
Figure 9: Select the trashcan icon.
-
- Click on modules and move the cursor to adjust their arrangement as desired.
- Click on the GREEN checkmark to the right of the Dashboard name to save the current view.

Figure 10: Save Dashboard edits.
-
- Click Yes to confirm the updates.
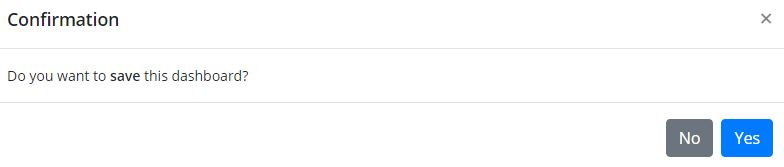
Figure 11: Save Dashboard prompt.
Set Custom Dashboard as the Primary Project View
Unless specified, the standard Project Dashboard displays by default when opening a WQData LIVE Project. To configure automatic display of a custom Dashboard:
- Navigate to ADMIN | Settings and go to the Project/Site submenu.
- Expand the Project drop-down and select the new dashboard under the Default Dashboard menu option.
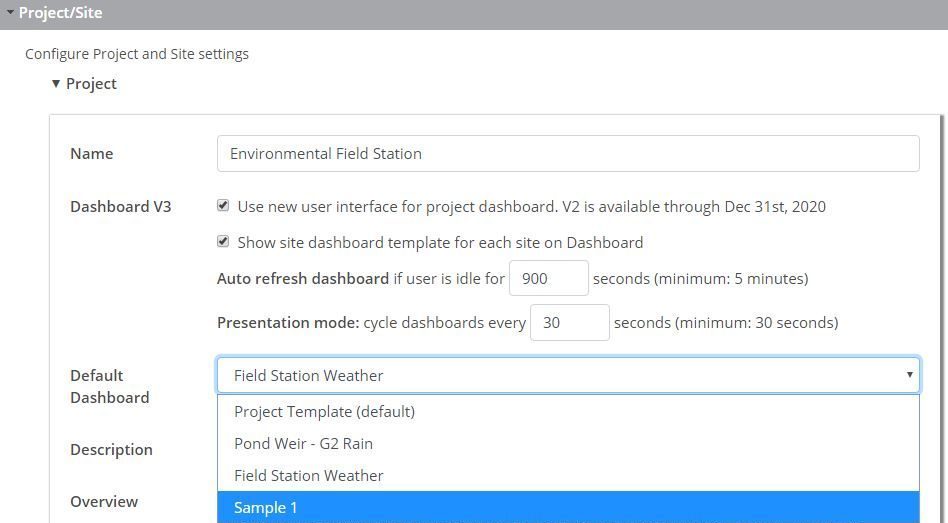
Figure 12: Set the Default Dashboard option to the newly-saved custom Dashboard.
- Scroll to the bottom of the Project menu and click SAVE.