
Those of us who work with water quality data spend extensive time and energy working to ensure we get the right data for our needs. However, one use for water quality data is frequently overlooked—and that’s putting water quality data to work in the classroom. In this post, we’ll cover some different ways to educate with water quality data and discuss how to integrate real-time environmental data into a curriculum.
Water Quality Data in Class
Water quality is a pressing concern worldwide, but there’s no better way to learn about it than locally, in the watershed that feels like home. Connecting global ideas like pollution, climate change, and water quality to local waterways through water quality monitoring and watershed assessment provides a chance for learning that’s unique, yet accessible across the country. This kind of learning also helps foster more engaged citizens, who become responsible stewards of their local ecosystems.
Watersheds that people live in and near are typically among those most affected by human activities. In classroom water quality modules, students can investigate their watershed’s characteristics using real data, such as dissolved oxygen levels, salinity, and water temperature. They can also explore how these parameters affect benthic creatures and other local species, and work to describe the relationship between the parameters.
Water quality data is easier than ever to come by in the classroom, thanks to various technological advances. Students can make use of real-time water quality data to develop scientific and problem-solving skills and explore the most critical environmental issues we face as a planet today. A scaled learning approach and simple tools for exploring data allow students to learn both in-person in the classroom with their peers, and online.
Creating a Classroom Water Quality Data Program
Developing a water quality monitoring program for just about any group of students is possible and can work in almost any natural setting, from urban to rural. These are some of the basic steps to take in order to create your program and get it on its feet.
Select a suitable body of water for the program. It should be easily accessible for both you and your students. It can be an estuary, stream, small river, or lake. For details about your local watershed from the EPA, including data gathered by local, state, and federal agencies and citizen groups, check the Surf Your Watershed page.
Next, identify which kinds of water quality data your students can gather most readily. Students of almost any age or skill level can participate in collecting water quality data. Biological, chemical, and physical parameters might be on your water quality data menu.
Biological water quality data usually starts with a survey of visible organisms, from plants in and out of the water and on the bottom, including algae, to benthic macroinvertebrates like crawfish, worms, and snails. Fish, of course, also count, as do waterfowl. Species should be identified, counted, and described. Finally, students should test for levels of microbiological organisms, including fecal coliform bacteria, which might reveal the presence of agricultural runoff, a sewage leak, or other problems.
Chemical water quality parameters include alkalinity, biochemical oxygen demand (BOD), dissolved oxygen (DO), nitrates, pH, phosphate and total dissolved solids (TDS). There are many ways to test for these parameters, many involving simple strips or tablets dropped into water samples. For older or more advanced students, more precise methods such as titrimetric tests that also provide higher resolution are also an option.
Physical water quality parameters include a simple visual inspection of the area, along with a detailed description of surrounding land use and the landscape itself. Other physical parameters include Secchi disk visibility, the temperature of both the water and the ambient air, turbidity, water velocity, and water level.
Once you’ve determined which parameters your students will pursue, decide who will use the data they collect. It’s valuable, and at a minimum you should keep it in a database that you maintain over the years. Students can use the results to help calculate a water quality index (WQI) for their watershed, using this calculator and information from the National Sanitation Foundation. They can also participate in World Water Quality Day and other events with their data so long as they collect dissolved oxygen, pH, temperature, and turbidity data at least once between March 22 and December 31.
Your next step on behalf of your classroom water quality data program is determining what to do with the information you discover. For example, say you’re monitoring in your local watershed, and the students find that there are elevated levels of nutrients, apparently from runoff, in a certain area? What will they do with their information?
Having real-time information about problems in the watershed means more investigatory power. It also means more ability to pinpoint problems and find out which procedures and policies are causing them. How will your students generate possible solutions for water quality problems? How will they present them to decision makers? Are there other ways they can develop and implement action plans to improve water quality?
Get creative. The students may not be able to solve every water quality problem they uncover with their data, but they aren’t helpless. Students can educate others in the community and use their data to teach. They can also turn educational programs into permanent fixtures in the community.
Your last stop as an organizer is ensuring your program using water quality data in the classroom is funded. Obviously, if the program is part of a traditional science course, you may already have funding. If your group is part of a club or lacks a course’s framework, though, there are still options. The US EPA offers Environmental Education Grants, and you can also find funding through the North American Association for Environmental Education, the NOAA, and at the state and local level.
Tying It All Together
It’s totally possible to create and grow a water quality monitoring program for students of just about any age or ability level. Collecting water quality data has value for researchers, policymakers, and the public, not just students who use it to learn. By compiling real-time data and making it available online, everyone gains a deeper sense of how healthy our waterways are.
NexSens customers can use the WQData LIVE web datacenter as a classroom resource for data access and integrating real-time environmental data into their curriculum. Find out more about how to use WQData LIVE sites and the Public Portal feature so that the public can access your water quality data by reaching out to the Fondriest team today.
Equipment
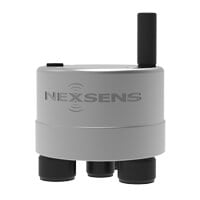
The X3 data logger offers the latest in real-time monitoring technology with wireless communication, a large plug-and-play sensor library, and ultra-low power consumption.
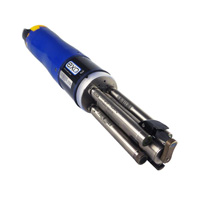
EXO3 is a purpose-built sonde for monitoring major water quality parameters, including: pH, conductivity, temperature, turbidity and dissolved oxygen.
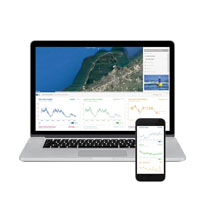
WQData LIVE is a web-based project management service that allows users 24/7 instant access to data collected from remote telemetry systems.
0 comments