Your are searching for: ichart reports
There are 17 results found
iChart Reference Guide
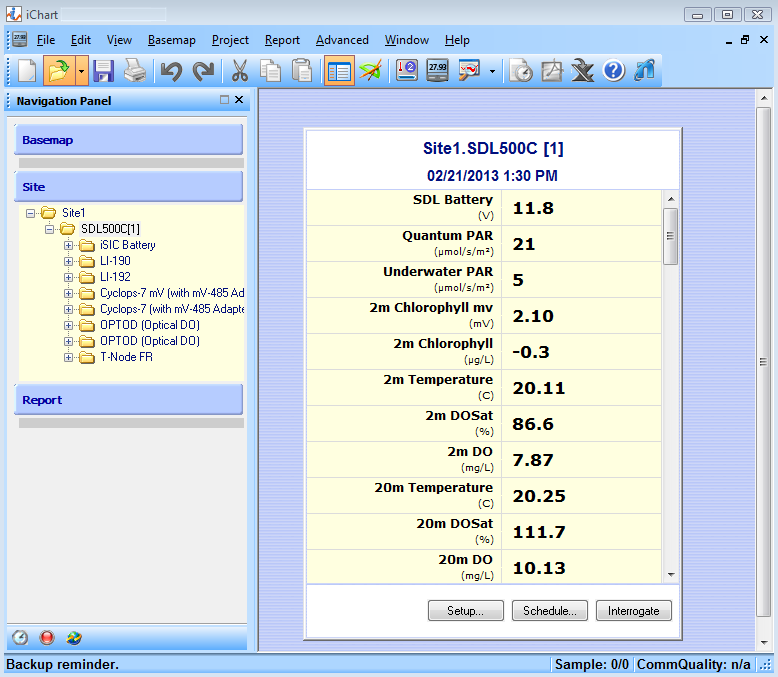
Main Project Window Title Bar The Title Bar displays the filename of the open iChart database. Menu Bar Many of iChart’s core features and functions can be accessed through the Menu Bar. Main Toolbar Main Toolbar Buttons from Left to Right: New Project – Creates a new […]
iChart Menu Commands
File Menu New Project – Creates an iChart database. iChart will display a menu – the Setup Device Wizard – to help setup the first database. Open Project – Launches an existing database. The iChart Project File window will appear so that the existing database can be selected and opened. Close – Closes an open […]
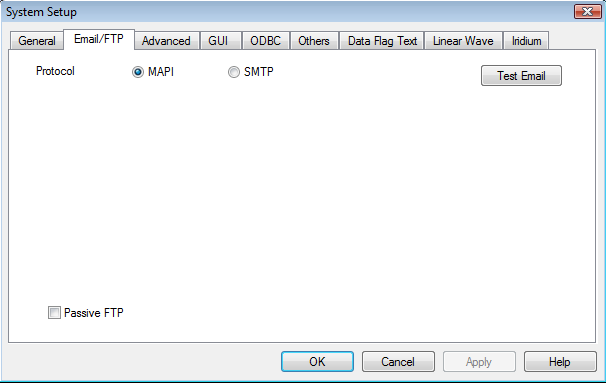
Setting Up Email Service in iChart
It is possible to send automatically generated email reports, alarms and alerts through iChart software. 1. Open iChart to begin. Go to Edit | Preferences. 2. The System Setup window should appear. Click Email/FTP. 3. Select the SMTP option. 4. Enter the sender’s information as it would appear in an email. In […]
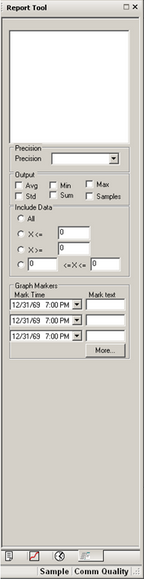
Adjusting the Precision of a Report
The Reports in iChart software can be customized to display data in different ways. Graphics can be adjusted for better viewing and statistics can be shown in several formals. 1. Open iChart with a current project. 2. From the menu bar select Report | Open Report. 3. Choose the desired report and click Open. 4. If the Report […]
SDL500 Optional Outputs
When set up as a direct connect data logger, The SDL500 submersible data logger can be preconfigured to output environmental data to SDI-12 or Modbus devices. SDI-12 output is typically used for connection to other data loggers, while Modbus output is mainly used for integration into Supervisory Control and Data Acquisition (SCADA) systems. The SDL500 […]
Adjusting Barometric Pressure for Local Elevation
Most barometric pressure sensors measure the absolute pressure of a location and do not account for the elevation above sea level. Since barometric pressure is conventionally reported (in weather reports, etc.) as an adjusted value referenced to sea level elevation, this may cause readings to appear artificially low, particularly at high elevations. To reference sensor […]
Exporting Data to a .csv Format
NexSens iChart software Reports are not the only way to view data gathered in iChart. There are easily accessible built-in functions to export the data to .xls, .pdf and .csv formats. 1. Open iChart with a current project. 2. From the menu bar select Report | New Report… 3. Again from the menu bar select File | […]