
The Reports in iChart software can be customized to display data in different ways. Graphics can be adjusted for better viewing and statistics can be shown in several formals.
1. Open iChart with a current project.
2. From the menu bar select Report | Open Report.
3. Choose the desired report and click Open.
4. If the Report Toolbar is not showing on the right side, then from the View menu select Report Tools.
5. Click on the Data tab located at the bottom of the Report Toolbar.
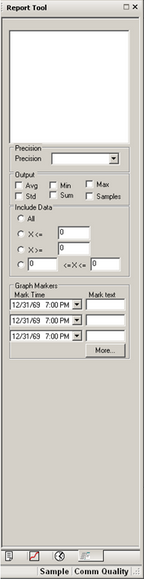
Figure 1: Data tab
6. From the Precision drop down menu select the desired number of decimal places. The report will automatically adjust to the selected precision.
REV: 13G29