
Main Project Window
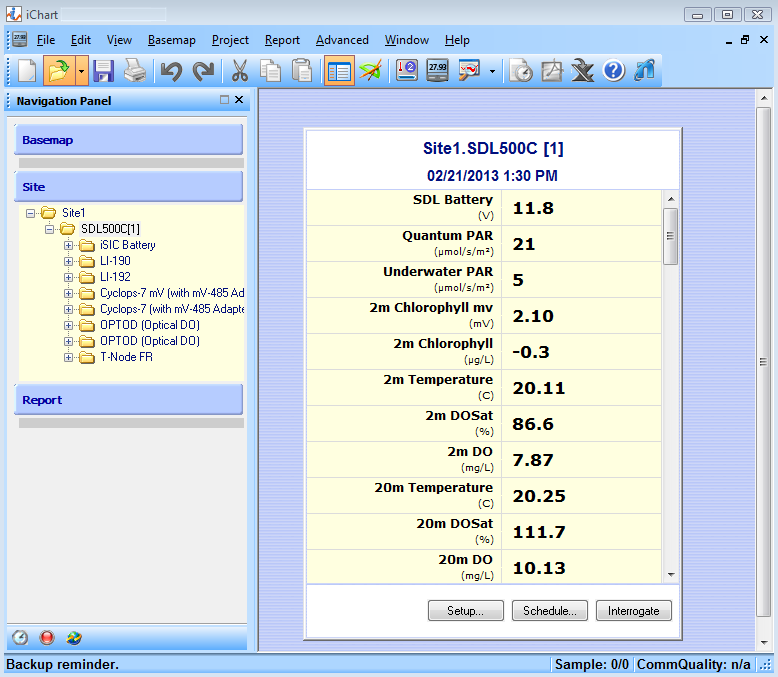
Figure 1: Main Project Window
Title Bar
The Title Bar displays the filename of the open iChart database.
Figure 2: iChart Title Bar
Menu Bar
Many of iChart’s core features and functions can be accessed through the Menu Bar.
Figure 3: iChart Menu Bar
Main Toolbar
Figure 4: iChart Main Toolbar
Main Toolbar Buttons from Left to Right:
New Project – Creates a new iChart database. iChart will display the Setup Device wizard to help setup the database.
Open Project – Opens an existing iChart database. iChart will display the Open Project dialog box, where the desired database can be located.
Save – In Report Mode, this button saves the report in HTML format.
Print – Prints the current iChart report or basemap.
Undo, Redo, Cut, Copy and Paste
Navigation Panel – Toggles the Navigation Panel on and off.
Instrument Control Tools – Toggles the Instrument toolbar to the right on and off.
New Basemap – This feature is no longer supported in iChart.
Instrument Mode – Takes users back to the Instrument Control Screen when other menu options are open.
New Report – Creates a new report and opens the Report Tool.
Schedule Tasks – This feature is no longer supported in iChart.
To PDF – In Report Mode, saves the current report in PDF format. Only enabled in Report mode.
To Excel – In Report Mode, saves the current report in CSV format. Only enabled in Report mode.
Help – Opens the iChart Manual.
NexSens Web – Opens NexSens.com.
Navigation Panel
The Navigation Panel provides quick access to core modules within iChart software – Site and Report. The Basemap feature is no longer supported in iChart.
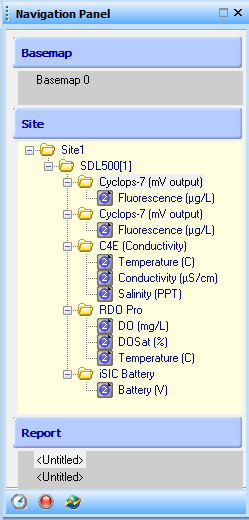
Figure 5: Navigation Panel
Site – Lists all sites, sensors and data loggers associated with the iChart database.
Report – Lists all open reports associated with the iChart database. Click a file to display that report within iChart.
Global Sample Interval – Clock icon. Sets a uniform sample interval for all devices without internal logging memory in the iChart database.
Auto-Interrogation Status – Red dot. Pauses and resumes auto-interrogation of sensors. A green icon indicates auto-interrogation is active. A red icon indicates auto-interrogation is paused. Click the icon to change its status.
Interrogate All – Globe icon. Interrogates all devices in the iChart database.
Instrument Control Screen
Instrument Control provides a direct interface to all devices associated with the iChart database. The Instrument Control Screen allows for setting auto-interrogation schedules, manually interrogating devices, displaying current data and showing parameters listed and their values.
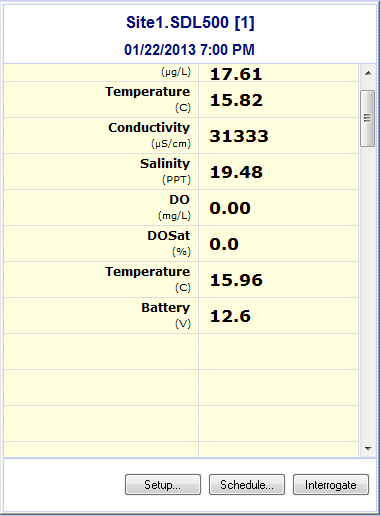
Figure 6: Instrument Control Screen
Setup – Opens the Setup Device window.
Schedule – Opens scheduling settings for interrogation and synchronization.
Interrogate – Manually interrogates the data logger and retrieves any new data recorded since the last interrogation.
Instrument Control Tools
With the Instrument Control screen open, click the Instrument Control Tools button. The Instrument Tool will appear to the right. The Instrument Tool is used to customize the display of data in the Instrument Control screen.
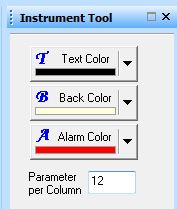
Figure 7: Instrument Tool
Text Color – Sets the text color for the data points displayed in the Instrument Control screen.
Back Color – Sets the background color for the data points displayed in the Instrument Control screen.
Alarm Color – Sets the background color to be displayed when an alarm is triggered for a certain parameter.
Parameter per Column – In some cases, a device or data logger may be configured to monitor a large number of parameters. Use this field to display the most recent data points in multiple columns.
REV: 13D12