
SeaView Systems SVS-603HR Wave Sensor X2 Integration Guide
Real-Time Wave Measurements
The SeaView Systems SVS-603HR Wave Sensor is a highly accurate wave sensor that reports heading, wave height, wave period, and wave direction. The sensor is compatible with NexSens X-Series data loggers via the Modbus-RTU communication protocol and the RS-232 sensor interface. A pre-defined script on X-Series data loggers is able to detect, log, and transmit all parameters programmed to output from the sensor. Parameter data is transmitted, in real-time, at a user-specified interval (e.g., 10 minutes) to the NexSens WQData LIVE Web Datacenter. There, data is stored on customizable dashboards with statistics and graphical interfaces for each parameter. Users can download and send data reports via Email, FTP, or an API. Below is information on the settings and wiring required to integrate these sensors with a NexSens X-Series data logger.
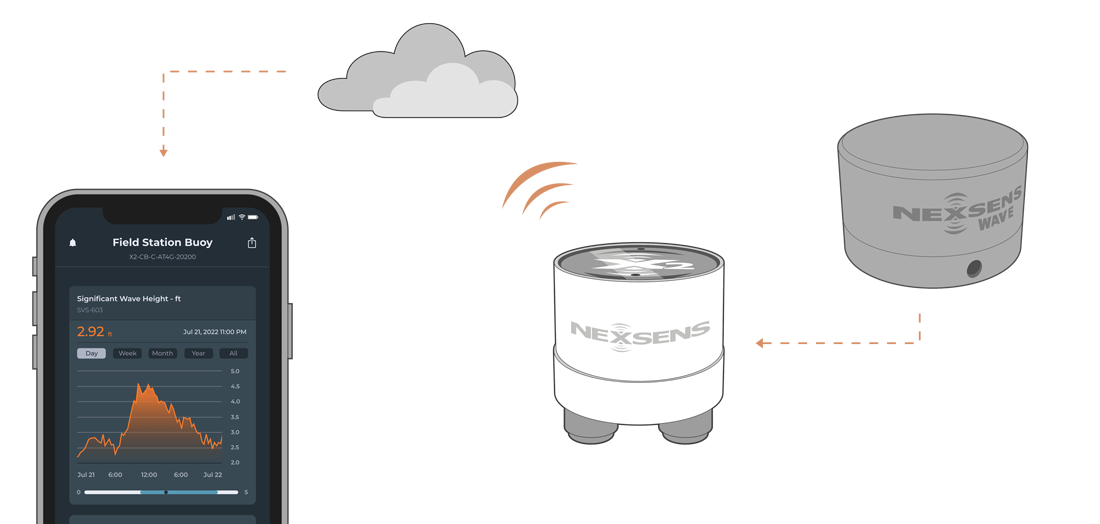
Figure 1: SeaView Systems SVS-603HR Wave Sensor integration with NexSens X-Series data loggers.
Compatible Models
SeaView Systems offers multiple models (SVS603, SVS603HR, & SVS603 HRi) of the SVS-603 wave sensor with varying capabilities that are compatible with NexSens X-Series data loggers. The internal script on the data logger will read this code upon detection to determine and log the parameter list.
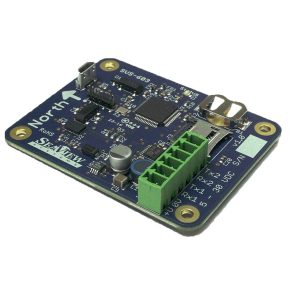
Figure 2: SeaView Systems SVS603, SVS603HR, and SVS603HRi wave sensor.
Wave Sensor Integration
NexSens X-Series data loggers include a default sensor profile for the wave sensor. This profile must be enabled before running the automatic sensor detection process. NexSens engineers configure the sensor communication before shipment, so no changes to the sensor settings are required.
1. Installation
Instructions for mounting are available here.
2. Automatic Sensor Detection
X-Series data loggers include a pre-loaded SVS-603HR profile. Use the CONNECT software to enable the profile (#3014) for sensor detection.
After the profile is enabled, connect the sensor to the data logger and initiate the automatic sensor detection process.
NOTE: If additional sensors will be included in the system, be sure to follow their respective integration guides before running a sensor detection. All sensors must be fully configured and connected before starting a detection.
3. Read Sensor Configuration – Confirm Sensor Detection
After approximately 5–10 minutes, read the sensor configuration to confirm that the sensors have been successfully detected by the data logger. Carefully review the parameter list to verify that all expected parameters are present and that they are reported in the desired units. Allow the system to collect several readings to confirm that the parameter values are accurate and reasonable.
4. Setting up WQData LIVE
Once an X-Series data logger has finished a new sensor detection, it will automatically push the sensor configuration to the WQData LIVE Web Datacenter. Follow the three articles below to create a WQData LIVE account and a project/site. Then add the data logger to the project using the included claim code.
- Create a WQData LIVE Account
- Create a Project on WQData LIVE
- Add a Data Logger to a Project on WQData LIVE
Sample Rate Note
By default, the SVS-603HR samples at approximately 1.72 Hz, collecting 2,048 samples over a 19.794-minute period. Once the full 2,048-sample set is complete, the wave sensor calculates and outputs summary values. These summary values are then polled and recorded by the data logger as the final measurement, after which the sensor begins a new 2,048-sample collection cycle.
For this reason, it is recommended to set the log and sample interval for the wave sensor to 20 minutes or greater. If a shorter interval is used, the same summary data will be repeatedly recorded, since the sensor does not update its output until a new 2,048-sample set is completed. As a general rule, the log and sample interval must always be greater than the SVS-603HR sampling period.