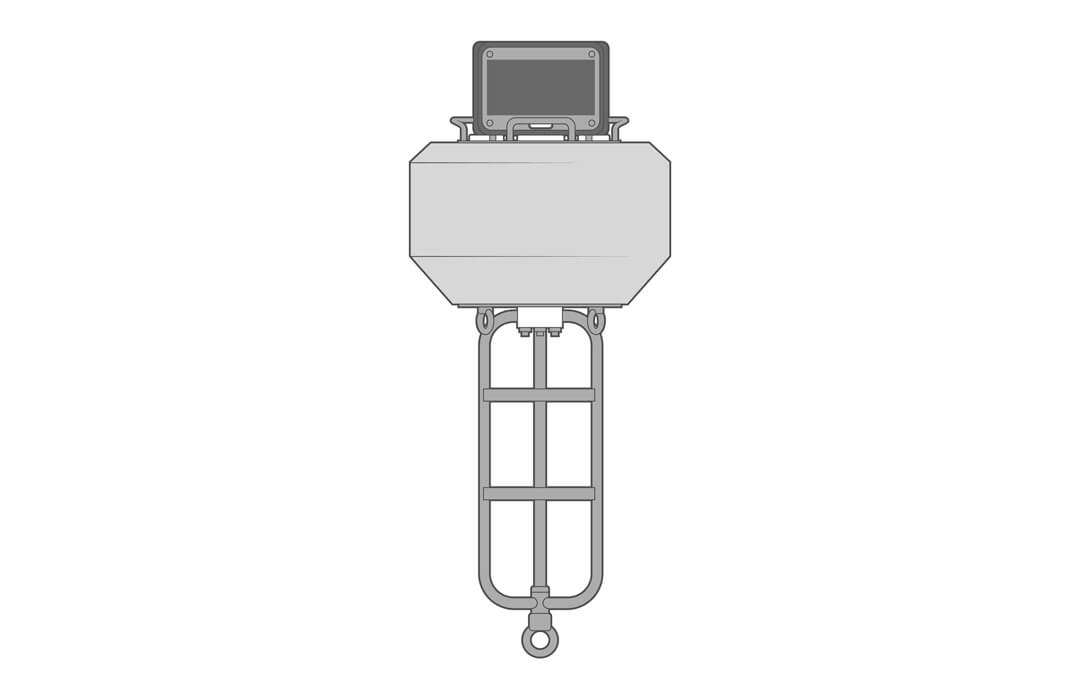
The CB-75 is a compact, affordable, and easy-to-deploy buoy platform for both water and atmospheric observations. Its compact and lightweight design makes it ideal for single-person deployment in coastal and inland waters. Constructed of cross-linked polyethylene foam with a heavy polymer skin and an indestructible stainless steel frame, the CB-75 is designed for years of […]
Read More →
Real-Time Water Quality Measurements The In-Situ Series of Multi-Parameter Water Quality Sondes (AquaTroll 200/400/500/600) are compatible with NexSens X-Series data loggers via the SDI-12 communication protocol and sensor interface. A user-generated script on NexSens X-Series data loggers can detect, log, and transmit all parameters output by the In-Situ sondes. Parameter data is transmitted, in real-time, […]
Read More →
Real-Time Weather Measurements The Airmar WX-series Ultrasonic Weather Station measures a host of atmospheric and environmental parameters while maintaining a GPS fix. The sensors are compatible with the X2 data logger via the NMEA0183 communication protocol and the RS-232 sensor interface. A pre-defined script on NexSens X-Series data loggers is able to detect, log, and […]
Read More →
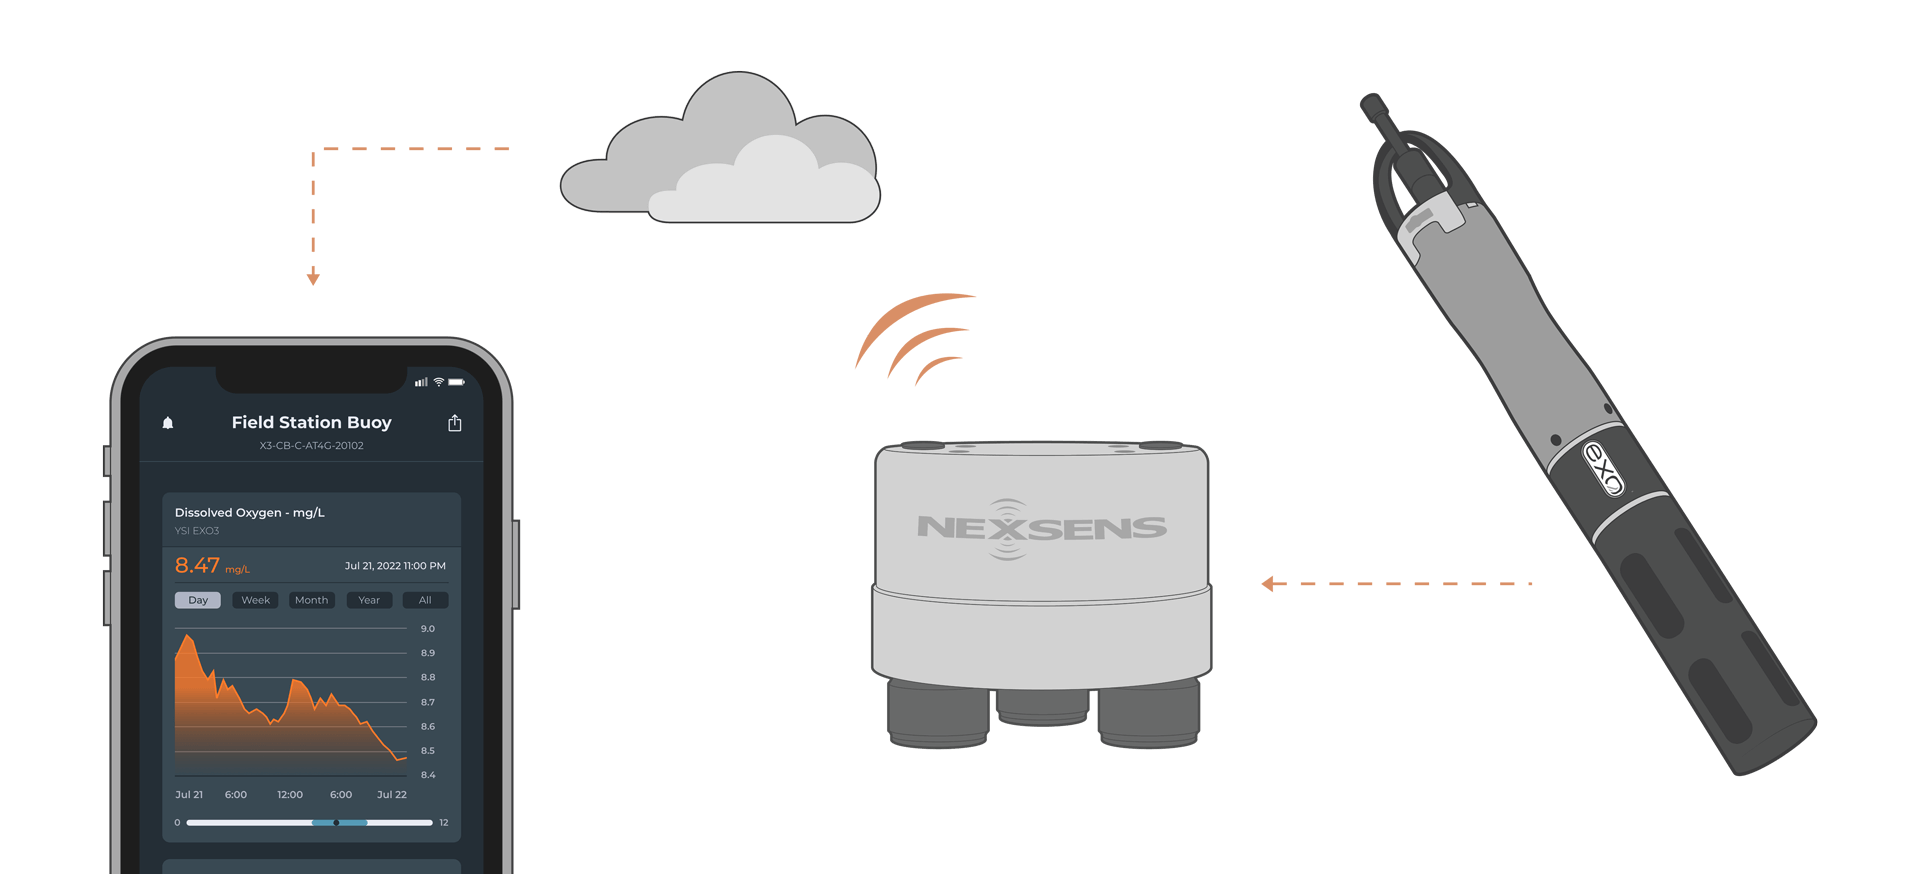
The YSI EXO Multiparameter Sondes can simultaneously measure multiple water quality parameters, including conductivity, temperature, pressure, dissolved oxygen, and many more. It easily integrates with NexSens X-Series data loggers using the SDI-12 sensor interface. Sensor Setup Before the sensor can be deployed, it must first be set up through KOR software. For proper communication with […]
Read More →
The NexSens NX260 Turbidity Sensor is an optical, self-cleaning sensor designed to measure turbidity. It is ideal for construction sites, dredging projects, stormwater monitoring, and other water quality applications where suspended sediments and water clarity are a concern. 1. Install software and set up the computer Download and install NexSens CONNECT software on a field or […]
Read More →
Updating iChart Software Updating iChart Moving iChart to a New Computer Restore a Backup iChart Project File Transfer iChart to a New Computer Placing a Project File (.icr) Into iChart Restoring an .idb File in iChart Backup or Transfer an iChart Project Updating iChart Project Changing Sensor SDI-12 Addresses Adding Devices to an Existing iChart […]
Read More →
Reports iChart Data Reports Setup iChart Automatic Reports Send iChart Reports to National Data Buoy Center Graphing Parameters on the Same Axis in iChart Reporting Only the Most Recent Data Reorder Parameters in a Report Adjusting the Precision of a Report For Interval Rain Data, Generate Total Monthly Rain Report For Daily Rain Data, Generate […]
Read More →
Advanced Features iSIC/SDL500 Code Updates in iChart iChart ODBC Connection Setup iChart Data Importing iChart Advanced Dialog Boxes and Menus Using iChart in Client/Server Mode Protecting an iChart Project File Setting Up Email Service in iChart Report Mode for iChart Creating an .idb File in iChart Reconfiguring a YSI Sonde With iChart Using Hyper Terminal […]
Read More →
Troubleshooting How do I Change the 12-hour Clock to a 24-hour Clock in iChart? How do I See Headers in iChart’s Data Replication File? How do I Unregister iChart Software? Is the Old iChart Report Overwritten When a New Report is Automatically Generated? What can I do if iChart Stops Automatically Collecting Data? When I […]
Read More →
Sensor Communication Resolving SDI-12 Sensor Communication Adding a LI-COR Sensor to iChart Adjusting the Offset of a Sensor Adjusting Barometric Pressure for Local Elevation Changing Lufft Weather Sensor Settings in iChart Connect a Lufft Weather Sensor for Configuration Configuring a YSI Sonde in iChart Reading mV Value From mV-RS485 Adapter Changing Lufft Configuration Settings via […]
Read More →