
Sediment Monitoring

Turbidity measurement is commonly accepted as a surrogate for sediment monitoring because it is convenient and relatively simple. However, some cases may call for more precise measurement of sediment concentrations in units such as mg/L. For these situations, real-time monitoring systems for total suspended solids (TSS) or suspended sediment concentration (SSC) are available.
Suspended Solids and Sediments

Typical Sediment Monitoring System
Since both TSS and SSC measurement can have applicability in surface waters, which method should be used depends on the specific situation. Another question is which sensor technology should be used to detect particles between optical turbidity and acoustic backscatter sensors. Optical turbidity sensors work well at small particle diameters up to ~30 microns but lose sensitivity above this and do not detect coarse particles well. Contrarily, acoustic backscatter sensors work well when larger, sand-size grain particles are present but may have variable response to very fine particles.
In a setting with primarily very fine sediments or if TSS is a given requirement, a common sensor choice is the YSI EXO3 sonde with turbidity sensor and central wiper to keep the optics clean. The EXO platform calculates TSS automatically based on correlation to true TSS values determined via laboratory analysis at various turbidity levels. In addition, a temperature and conductivity sensor can be added to the sonde to calculate total dissolved solids (TDS), which is the fraction of ions and particles that can pass through a 2 micron filter, or sensors for algae and CDOM which may also influence turbidity readings.
When a substantial amount of relatively large particles are present or if sediments should be reported as SSC, an acoustic sensor may be a preferred technology.
This leaves situations where a wide range of grain sizes is expected. In such cases, an ideal sensor choice is the NX260 Turbidity Sensor.
All of the aforementioned sensor types are compatible with the NexSens X3 environmental data logger platform, which can be delivered with a pole/wall-mount bracket, buoy-mount configuration, or as a fully submersible X3-SUB unit. All versions support wireless communications modules and offer multiple sensor ports for multi-instrument configurations. Real-time data is published on the WQData LIVE web datacenter, which provides remote logger controls, data reporting tools, alarms, and much more.
Contact a NexSens Applications Engineer today to discuss your sediment monitoring application.


Purchase in the USA
Visit our US distributor, Fondriest Environmental, to purchase online.
Purchase Internationally
Click the button below to find a local distributor.
Contact a NexSens Applications Scientist
Need help designing an Environmental IoT system? NexSens applications scientists will help you design the perfect monitoring system to meet field conditions and monitoring needs.
Case Studies
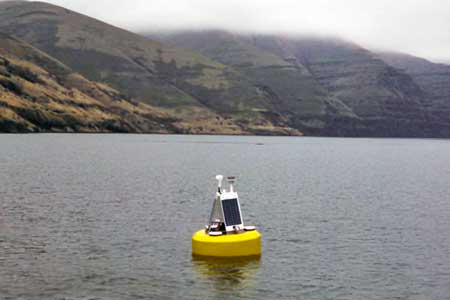
Snake River Sediment Dredging
The Snake River is an important lane for transportation and shipping goods in the Pacific Northwest region of the US, but sediment buildup over time slows transportation down. The U.S. Army Corps of Engineers typically steps in to dredge the river when sediment levels get too high, and buoys are used to carefully monitor suspended sediments during the process.
Read More About Snake River Sediment Dredging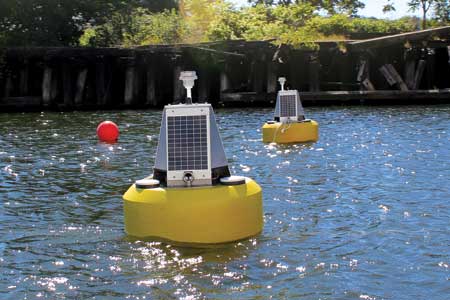
Buffalo River Shipping Channel Cleanup
The Buffalo River shipping channel has a history of industrial use that has left contaminated sediments at the channel bottom. Over the years, the U.S. Army Corps of Engineers (USACE) and U.S. Environmental Protection Agency (EPA) have worked with many partners to dredge out the sediments, and a central component of these programs is real-time monitoring.
Read More About Buffalo River Shipping Channel Cleanup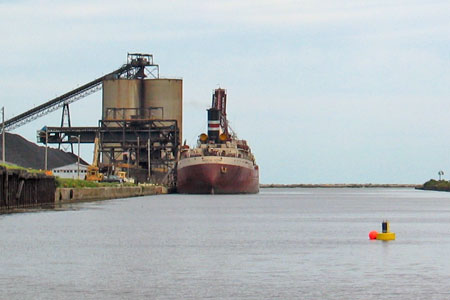
Sediment Re-suspension Monitoring
From the 1940s to the late ‘70s, the area surrounding the mouth of the Ashtabula River experienced significant industrial development that left behind contaminants in the river sediments. Dredging was performed to remove the sediments, and a monitoring system was put in place to ensure that the amount of re-suspension did not exceed specified ranges.
Read More About Sediment Re-suspension Monitoring