
If rain data has been collected in Intervals (Interval Rain), the iChart Report Tool may be used to generate a Total Monthly Rain report.
1. In the current iChart project file, click Report | New Report. The Report Tool will appear.
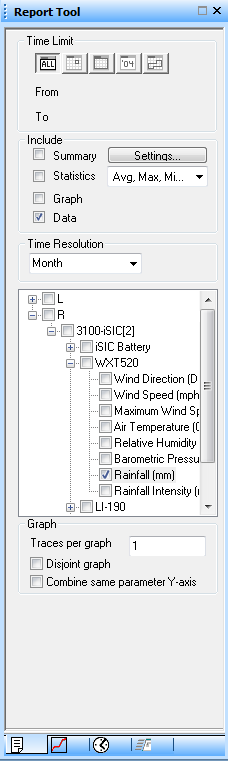
Figure 1: Report Tool
2. In the Time Limit section, select All.
3. Within the Include section, check Data.
4. In the Time Resolution dropdown, select Month.
5. Expand the site with the weather sensor that was used to collect rain data. Place a check mark in the box beside the rainfall parameter. Data for the parameter should come into the report window.
6. Navigate to the Advanced tab of the Report Tool (at bottom, 4th tab from left).
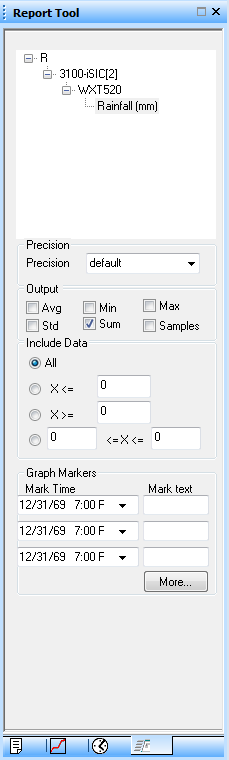
Figure 2: Advanced tab in Report Tool with Sum checked
7. In the Output section, place a check mark in Sum. This will total the rain data in the report window.
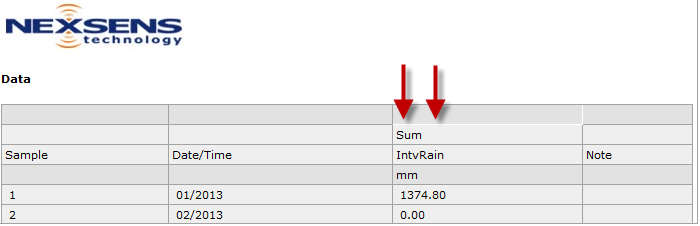
Figure 3: Total Monthly Rain Shown in Report Window
REV: 13J17