
Generating Data Reports
Data Reports are used to present data within WQData LIVE. Reports are highly customizable and may contain many combinations of project information, graphical and tabular data, statistics and alarms. Once generated, reports may be saved (“memorized”) for quick viewing in WQData LIVE, downloaded to PDF, sent via email or FTP, or configured with a schedule to automatically send periodically.
Begin by generating and customizing a report. From the Project Dashboard, select the Data, Alarm, or Rain Event option underneath the REPORT header.
- The Data option creates a report with data from one or multiple sites.
- The Alarm option creates a report of the triggered alarms within one or multiple sites.
- The Rain Event option creates a report of the rain events that have occurred with a G2-RAIN system.
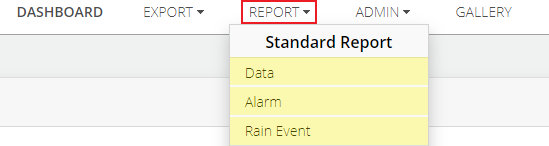
Figure 1: REPORT | Standard Report options.
Report Tool
After selecting the report type, the report tool will open. Use this to configure the report options.
- Select Parameters to choose the parameters that should be in the report.
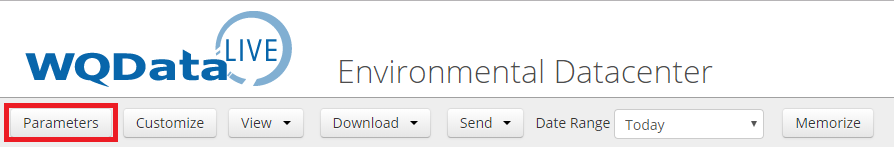
Figure 2: Parameters menu.
- A list of the available Sites will appear in the window. For each Site to be included in the report, click the site name to view the parameters list, and place a check mark beside the parameters that should be in the report. The chosen parameters will show up on the right in the Selected Parameters list.
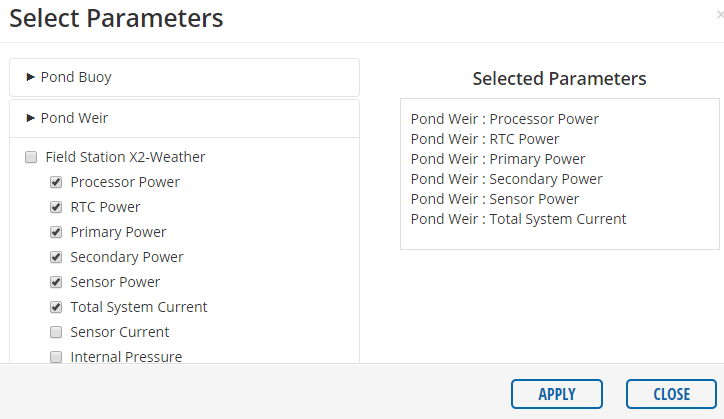
Figure 3: Selected Parameters list.
- The View drop-down menu changes the data display format.
- The Header option displays the name of the site, the name of the report, and the date of report creation.
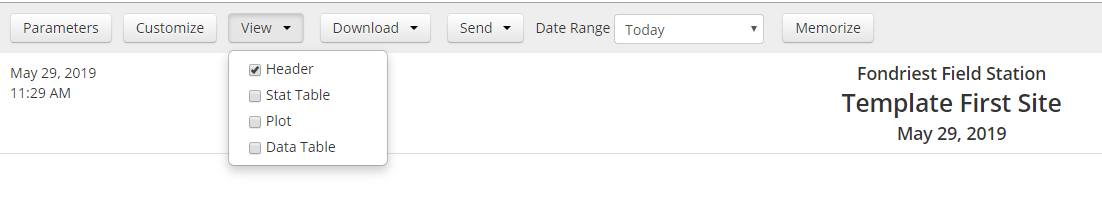
Figure 4: Header option.
-
- The Stat Table option displays basic statistics associated with the selected parameters.
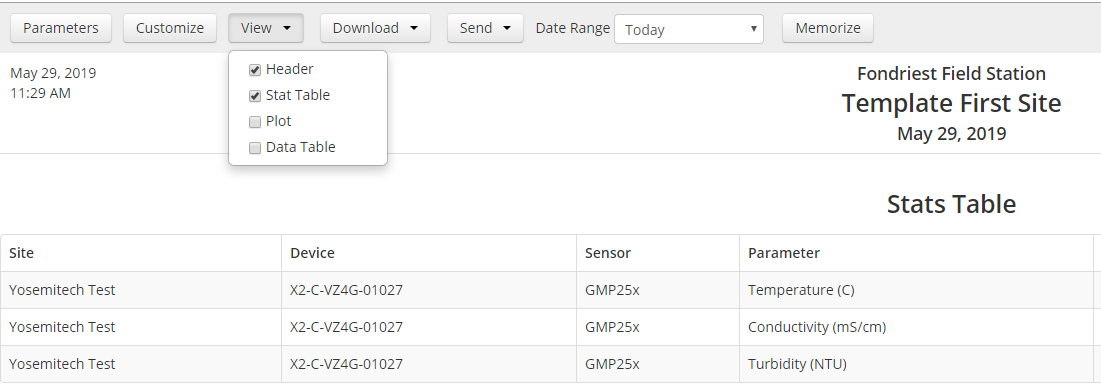
Figure 5: Stat Table option.
-
- The Plot option places the data in graphical displays. To combine the data into one graphical display, click the Combine option. To separate into multiple displays, click Separate.
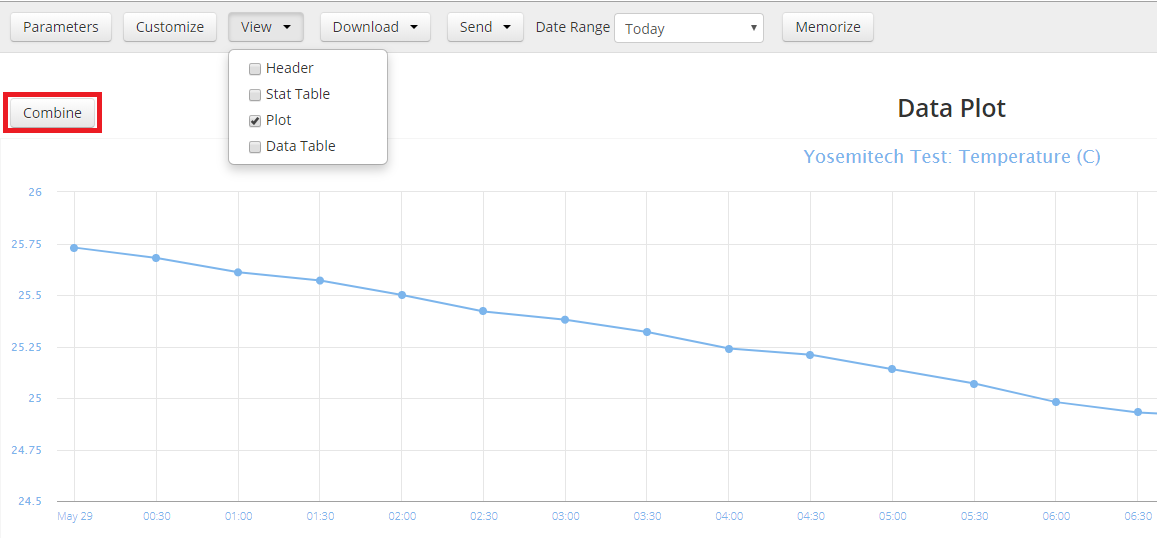
Figure 6: Data Plot option.
-
- The Data Table option shows all of the parameter data points recorded within the user-defined timeframe.
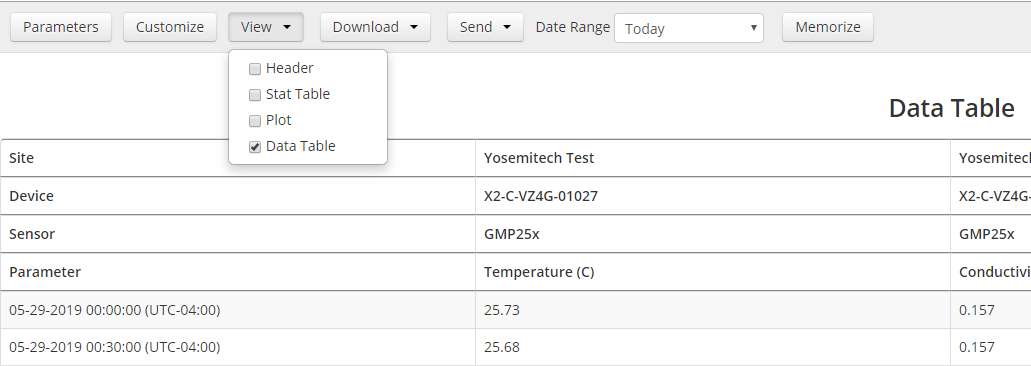
Figure 7: Data Table option.
For more information on customizing, saving/memorizing, and sending reports, follow the links below.