
Customizing Data Reports
The Customize menu of the report tool allows for further refinement of a loaded report through features like data condensing, data filtering, and the enabling of variable upload intervals (instead of a fixed time interval).
If a report has not yet been created, begin by referencing Generating Data Reports to create a data report.
After generating a report, select Customize at the top of the page.
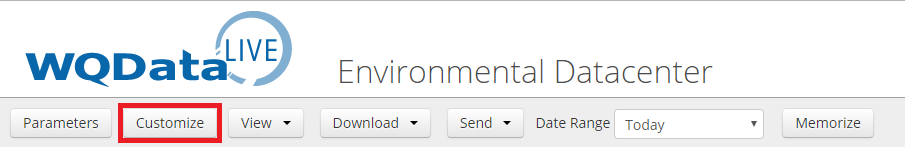
Figure 1: Customize menu.
The following features are available:
Note: Click Apply following changes made using any feature before proceeding to other features.
- Data: This feature defines the time range for data displayed in the report and provides the option to condense the data.
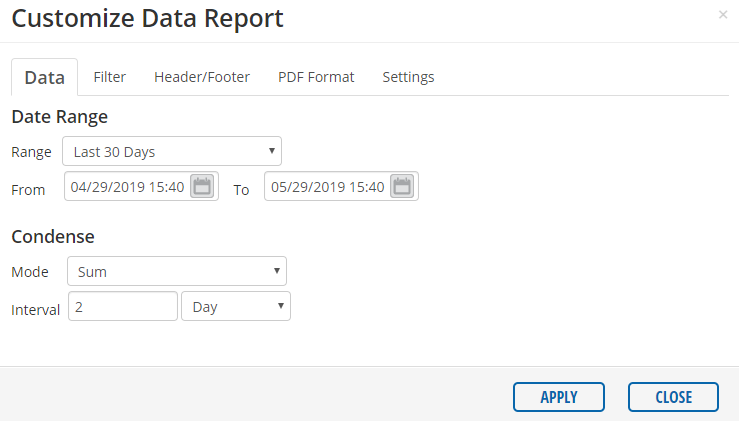
Figure 2: Date Range and Condense fields.
-
- For the Date Range, select a predefined interval from the list, or select Custom to manually set the data report time constraints.
- Select Fixed to set a specified time and date for the report. Note that data will always be loaded from the specified interval, regardless of when the report is generated, if this option is selected.
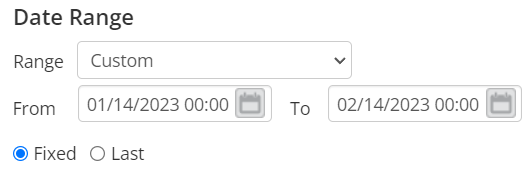
Figure 3: Fixed custom interval example where the report will always contain data from 1/14/2023 to 2/14/2023.
-
- Select Last for the report to always include the most recent data for the time period specified in the Range field.
- This option is most commonly used for saved reports that are configured to send automatically via email or FTP.
- The current local time (based on user account settings) at report generation serves as the endpoint of the report.
- The selected date range determines the starting time of the data record.
- Select Last for the report to always include the most recent data for the time period specified in the Range field.
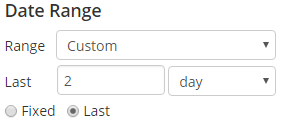
Figure 4: Last interval option example where report would always contain the most recent 2 days of data when loaded or automatically sent.
-
- The Condense option combines data points by taking the sum, average, minimum or maximum over a specified time interval.
- Filter: This feature allows the selection of minimum and maximum values for a parameter shown in the report.
- Choose a parameter from the Filter Parameters list on the left. Input a minimum and a maximum value in the Min and Max fields, respectively, and then click Add Filter. The selected filters will then appear in the list on the right.
- All data points for a given parameter that fall outside the designated Min and Max thresholds are excluded from the report.
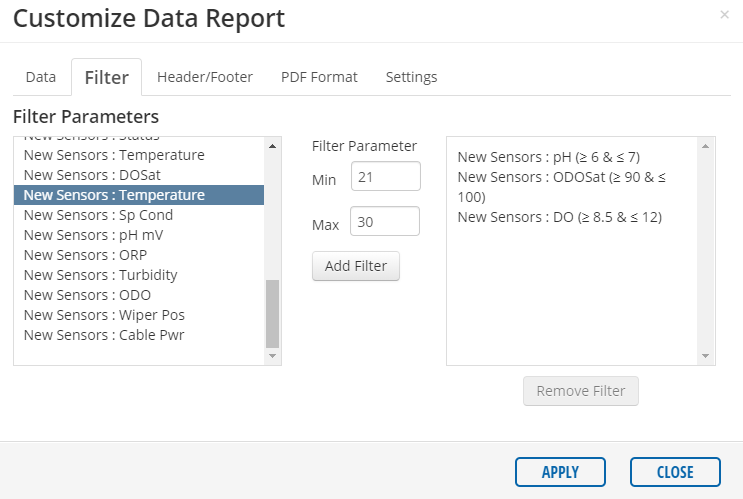
Figure 5: Filter Parameters configuration menu.
- Header/Footer: This feature modifies the header and footer, which then display on downloaded or exported reports.
- Possible edits to the header include the title(s), date prepared, and time format (12-hour or 24-hour). These appear immediately at the top of the page when changes.
- Changes to the footer, such as the page number display and additional footer content, appear in the downloadable PDF format of the report.
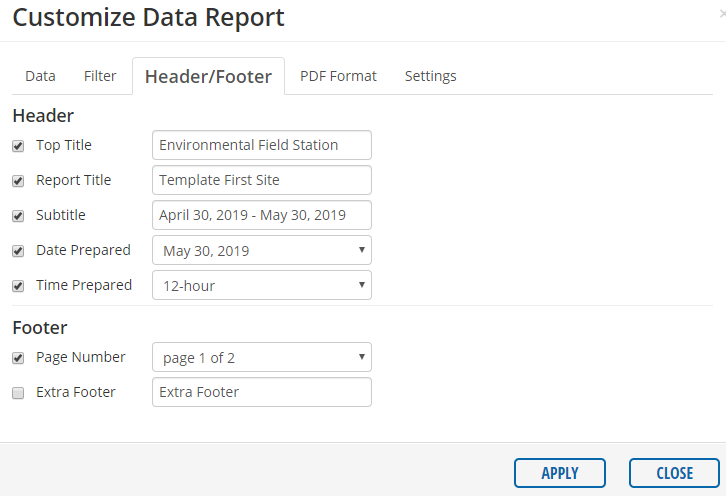
Figure 6: Header/Footer configuration menu.
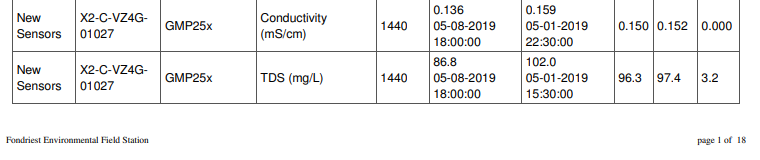
Figure 7: Example footer on the downloadable PDF report that contains the Page Number display and Extra Footer content.
- PDF Format: This feature customizes the downloadable PDF format of the data report.
- Included in the PDF Format options are the paper size and orientation, and the ability to toggle various report sections on and off (the same options available during the generation of the report on the WQData LIVE interface).
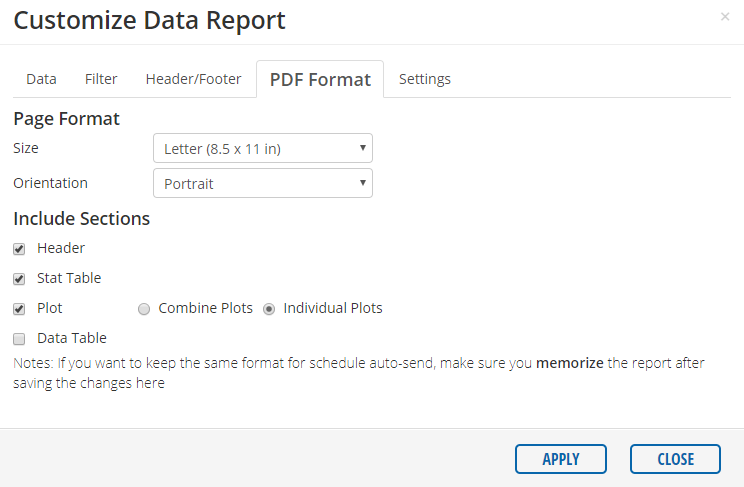
Figure 8: PDF Format configuration menu.
- Settings: This feature allows for assigning the report name, adding a description and changing the report time zone to match the local time.
- For a memorized report, there is an additional Delete Report option.
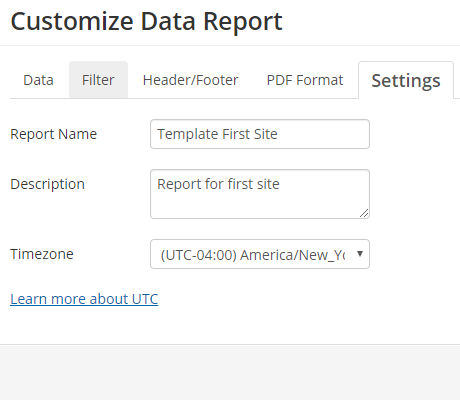
Figure 9: Settings for a non-memorized report. |
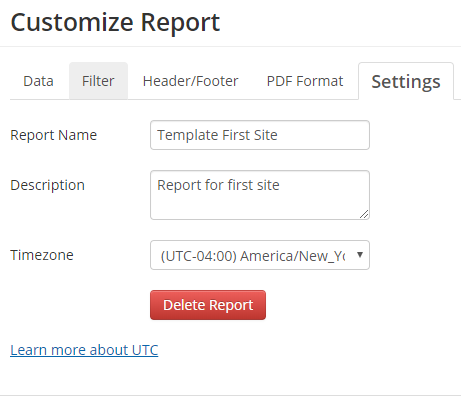
Figure 10: Settings for a memorized report. |