

Customers of NexSens and Fondriest are now able to purchase the LISST-ABS sensor online through the Fondriest website, which has just recently become available. In this post, we’ll discuss how the alternatives currently available get the job done, how this sensor works for suspended solids monitoring, and how results from the LISST-ABS compare to those from other methods.
Options for Suspended Solids Monitoring
Right now, when it comes to suspended solids monitoring, customers are using NexSens X2 data loggers to interface with a suspended solids sensor and transmit data wirelessly. For standalone (non-telemetry) applications, the NexSens X2-SDL can serve as both the power supply and data logger for the sensor—with the entire package being submersible to 200 feet.
On the other hand, many customers require telemetry for their applications. In cases like these, the NexSens pole-mounted X2 works well for shallower bodies of water such as streams, while the X2-CB and X2-SDL can be used with our CB-Series data buoys when deploying the sensor in lakes and rivers.
How the LISST-ABS Sensor Works
LISST-ABS is Sequoia’s Acoustic Backscatter Sensor. This sensor was created to measure the concentration of suspended sediments at a single point. In contrast to acoustic doppler current profilers (ADCPs) which record the strength of similar backscatter all along acoustic beams at various points or ranges, the LISST-ABS measures and reports signal strength of backscatter at just a single point.
The sensor measures the strength of the signal from about five centimeters away from the transducer itself. Measuring backscatter from a short distance has several major benefits. First, water attenuation is no longer significant given the short path the signal travels in the water. This also means that fluctuations related to water temperature are insignificant.
Finally, the short distance means that sediment attenuation is small, and even at high concentrations, accurate measurements can be made. The instrument measures attenuation caused by sediment internally, which allows it to correct the strength of the backscattering signal, enabling proper operation despite higher concentrations of sediment.
Next, the instrument sends the data about the backscatter signal strength in 3 formats, as an analog voltage, RS-232 digital data, and SDI-12, to the underwater connector. The data is presented as mg/L, in uncalibrated concentration, for both the SDI-12 and serial (RS-232) formats. In the analog voltage format, the analog voltage is logarithmic and scaled to the attenuation-corrected-backscatter (ACB).
Another unique point about the LISST-ABS is that it employs a high 8MHz frequency to work. This way, despite a wide range of particle sizes in a sample—from ~40-500 microns—the strength of the backscatter signal calibration remains almost constant. In fact, despite this significant range in particle sizes, calibration of the LISST-ABS sensor fluctuates only about ±30%.
Considering that optical turbidity sensors in that same particle size range would experience calibration changes of approximately ±600% over mean value, this is tremendously significant, and among the major benefits to using LISST-ABS over other turbidity sensors. Furthermore, you can interchange any LISST-ABS instruments because they are calibrated at the factory to be equally sensitive.
There is neither a data logger nor a battery on this instrument.
Comparing the LISST-ABS Sensor and Other Methods
For particles of sediment >30 microns, the LISST-ABS has an almost constant volts/concentration sensitivity. Compared to optical turbidity, this is greater sensitivity; optical methods see a degradation in sensitivity as grain size increases. In fact, actual field data reveals that estimated concentrations from the LISST-ABS match physical samples.
The usual vertical profile of sediment in a river is the sum of suspended sediment load and a wash-load. Wash-load is made up of fine particles that fail to settle, and instead “wash” away downstream. Wash-load sediment has a constant concentration as it moves through the river column as it is well-mixed.
As a point of comparison, the suspended load is usually sand. The particles in the suspended load range from fine to coarse that exists solely because turbulence causes particles from the river bottom to become re-suspended. The concentration of the suspended load reaches a maximum at the river bed and moving away from the bed vertically, it decreases. This is called the Rouse profile by river sedimentologists and others in related fields.
When it comes to comparing readings from a LISST-ABS sensor and other tools, the results can be striking. Optical turbidity sensors miss Rouse profiles revealed by a LISST-ABS sensor in some settings, especially close to the banks where particles are smaller and easily missed. In fact, comparing results from physical samples and the LISST-ABS shows an agreement.
Equipment
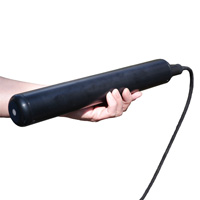
The Sequoia LISST-ABS is a submersible sensor capable of measuring the concentration of suspended sediment in water using acoustic backscatter.
The X3 data logger offers the latest in real-time monitoring technology with wireless communication, a large plug-and-play sensor library, and ultra-low power consumption.

WQData LIVE is a web-based project management service that allows users 24/7 instant access to data collected from remote telemetry systems.
0 comments