

WQData LIVE Web Datacenter
Features
Device-to-Cloud Communication
Data loggers send sensor measurements to WQData LIVE, securely storing them in the cloud for easy access. Adjust settings and resolve issues from anywhere, reducing the need for on-site visits. Simply send commands, and the logger updates automatically, saving time and effort.
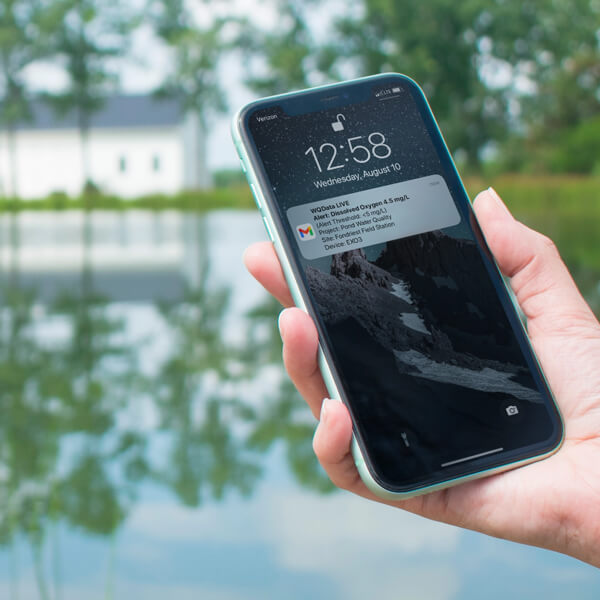
Modify measurement intervals with a single click. Get instant email alerts when readings change. Alarms reset automatically once conditions return to normal, ensuring reliable data management.


Device-to-Cloud Communication
Data loggers send sensor measurements to WQData LIVE, securely storing them in the cloud for easy access. Adjust settings and resolve issues from anywhere, reducing the need for on-site visits. Simply send commands, and the logger updates automatically, saving time and effort.
Modify measurement intervals with a single click. Get instant email alerts when readings change. Alarms reset automatically once conditions return to normal, ensuring reliable data management.
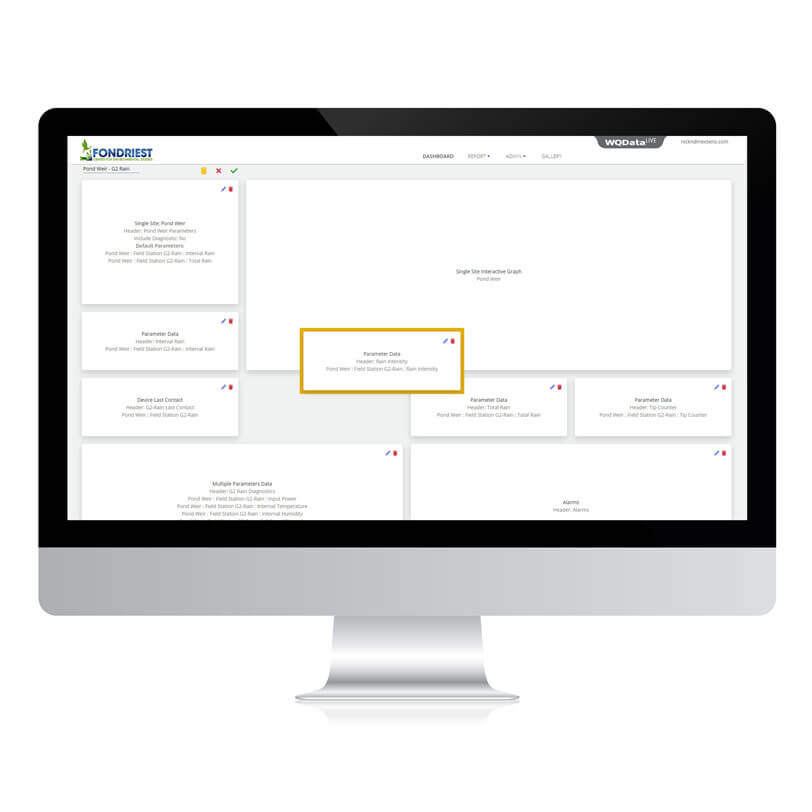
Customizable Dashboards
Create and personalize multiple dashboards to display data the way you need. Set them to cycle automatically or use a single, scrollable layout for a complete overview. Default dashboards can be customized to fit any project with just a few clicks.
Editing is simple—click the edit icon and rearrange panels using drag-and-drop. Choose from maps, device lists, live video, project photos, graphs, alarms, and more. Build dashboards that show the most important information at a glance.
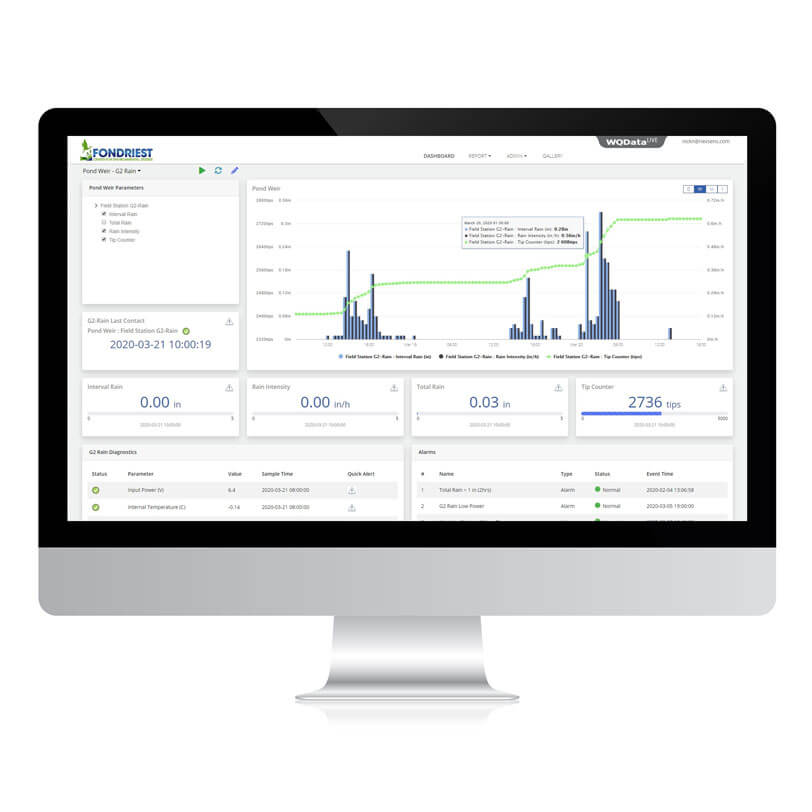
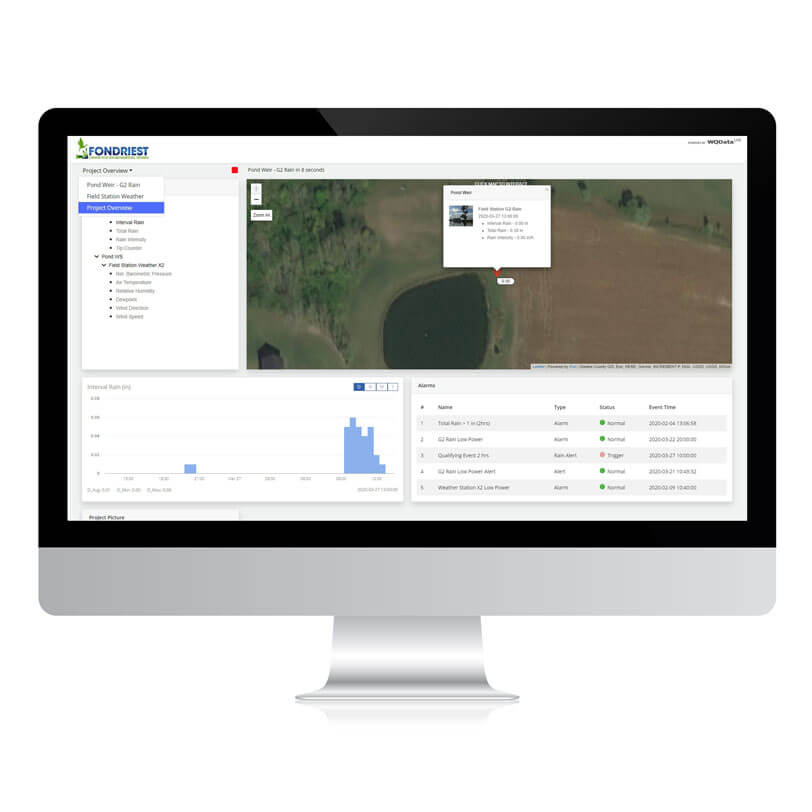
Interactive Dashboard Displays
Graph one or multiple parameters by selecting them from the site list or map for a personalized data display. View data by day, week, month, or year to fit analysis needs. Zoom in on specific events for a closer look, or reset to see the full timeline.
Explore project locations with ESRI Leaflet maps, using precise markers for better clarity. Click on site markers to view data and photos. Color-coded indicators and highlighted values make it easy to spot event conditions.
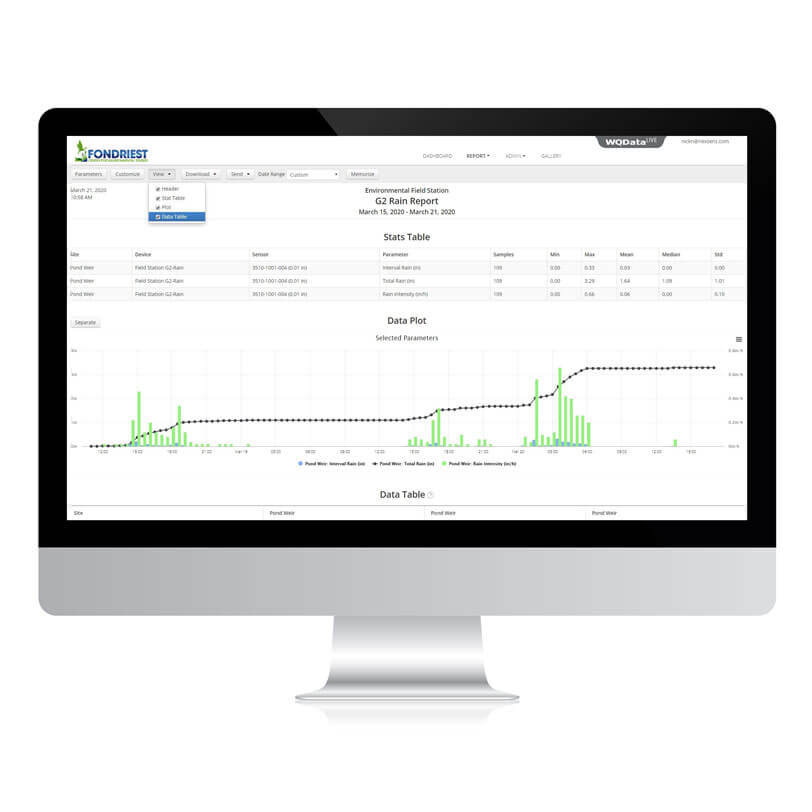
Effortless Report Generation and Sharing
Pre-built templates create new multi-site, multi-parameter reports. Make data easier to understand by adding charts, statistics, tables, and field notes.
Post to an FTP site, email, create PDF files, or download them to spreadsheets. Save reports to generate and share.
Encourage Team Collaboration
Collaboration is seamless while protecting data from loss or unwanted changes. Project leaders can invite team members and set access levels, ensuring security. Members can view dashboards, create reports, set alerts, and more.
Teams can upload project or site photos to the cloud. Visuals are stored in a central location for quick and easy access. Create albums of similar images to keep them organized. Include descriptions and notes to enhance data interpretation.
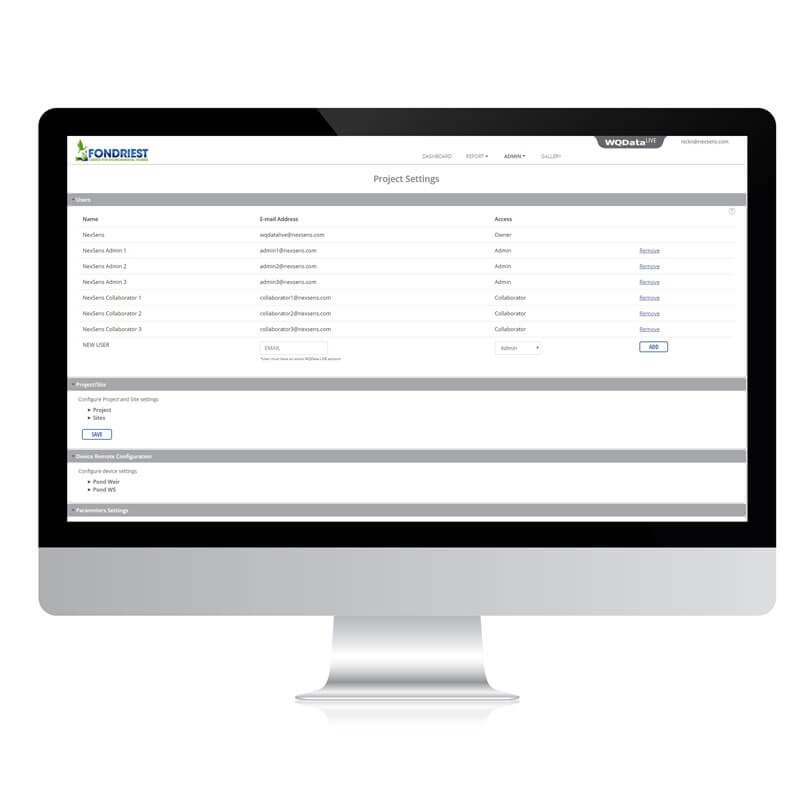
Share with a larger group of stakeholders
Make project data accessible through WQData LIVE’s public portal. Create a unique project link for anyone to access the data. Include a project overview, map, photos, and data displays in a slideshow.
Viewers can enable notifications of measurement changes to receive instant updates. Activate the donation option to encourage public funding and support for your project.
Application Programming Interface
Easily access real-time data using the WQData LIVE REST API. Send data to an external database or website for improved accessibility and control.
Configure up to 10 API keys per project to manage access and security. Retrieve data within a set period, with support for approximately 5,000 data points per request.
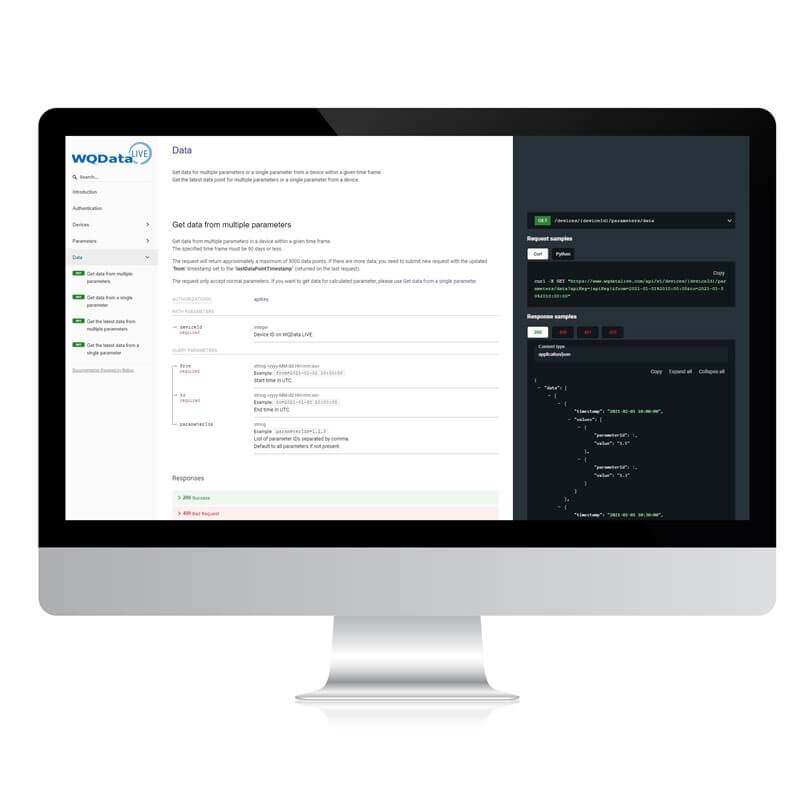
Purchase in the USA
Visit our US distributor, Fondriest Environmental.
Purchase Internationally
Find a regional partner.
Contact a NexSens System Specialist
Need help designing an environmental measurement system? A NexSens application scientist will help you design the perfect monitoring system to meet field conditions and measurement needs.
Example Project Data
Select from these WQData LIVE projects using the Public Portal feature to see how easy it is to access and share environmental data.


Fondriest Center for Environmental Studies
Education and Research Center


Regional Science Consortium
Tom Ridge Environmental Center at Presque Isle
Documents
Plans
Videos
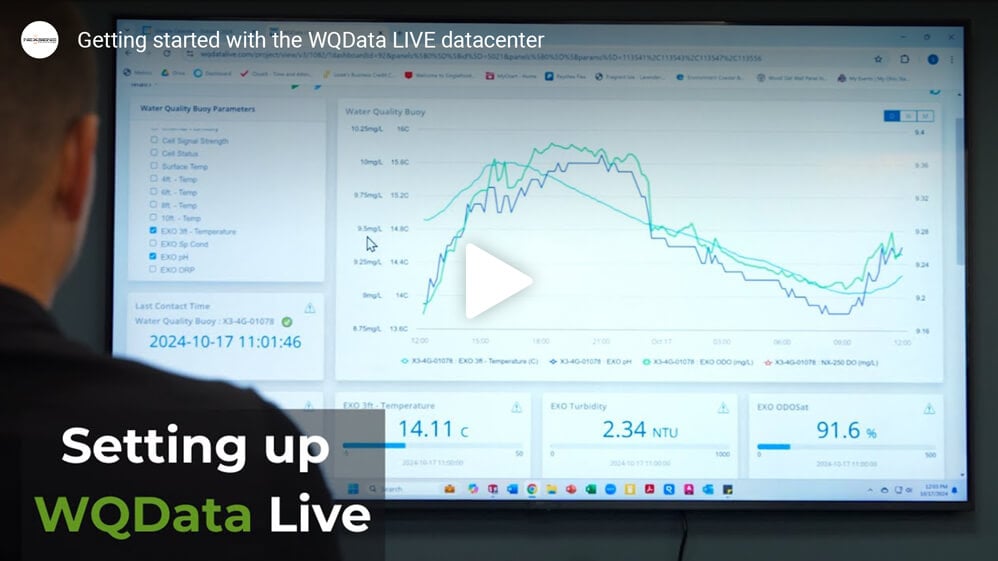
Getting started with the WQData LIVE Datacenter
Getting Started with WQData LIVE Advanced Features
Case Studies
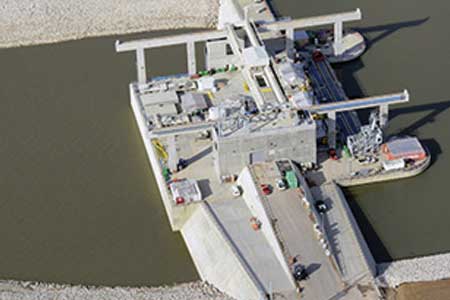
Cannelton Dam Hydroelectric Project
At six different sites along the Ohio River, American Municipal Power, Inc. (AMP) is retrofitting existing locks and dams operated by the U.S. Army Corps of Engineers to generate environmentally friendly hydropower. Many of these projects have broken ground over recent years, but the first to get underway was at Cannelton Locks and Dam, located along the Ohio River near Cannelton, Indiana. Work to retrofit the dam commenced in 2010, and the hydropower plant came online in June 2016. The plant is located on the Kentucky side of the river, near Hawesville. It diverts water away from the existing dam and into bulb turbines that can generate around 458 million kilowatt-hours of energy annually. A focus throughout the project has been to minimize the environmental impact during construction and now during operation. A key component of this objective has been long-term monitoring of the Ohio River’s temperature and dissolved oxygen levels, two parameters critically important for the aquatic ecosystem.
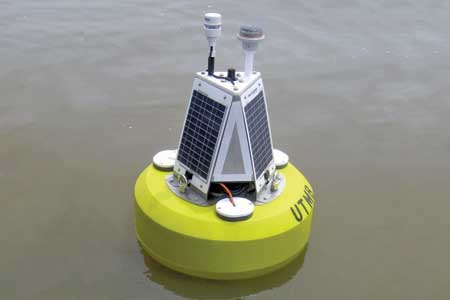
Maumee Bay Algae Monitoring
In order to protect the millions of people who rely on Lake Erie for drinking water from the threat of harmful algal blooms in its water, nearby universities and state agencies have coordinated monitoring efforts to better predict the presence of algal toxins. Their work has helped expand a network of data buoys in the great lake that keep an eye on water quality with an aim to avoid another drinking water crisis like the one that affected residents of the City of Toledo in August 2014. One such collaborative project has yielded a new data buoy in Lake Erie’s Maumee Bay, near the area that spawned the August 2014 toxic algal bloom. But instead of deploying the buoy close to the city’s water intake, it has been placed 8 miles away to provide early warnings of blooms, and give water managers more time to adjust operations or warn city residents. The Maumee Bay algae monitoring platform’s purchase was funded by the Ohio Board of Regents, while its operation is overseen by scientists at the University of Toledo.
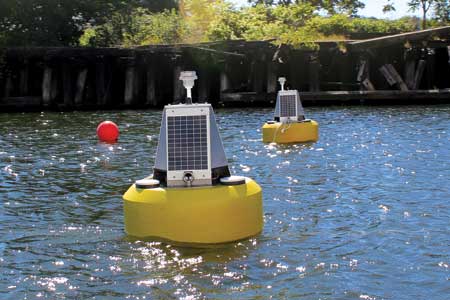
Buffalo River Dredge Turbidity Monitoring
New York’s Buffalo River has a legacy of industrial contamination, like a lot of other Great Lakes rivers and harbors. But its past of sustaining large influxes of industrial effluent has netted it the distinction of being named a Great Lakes Area of Concern. With its dirty legacy flowing right through their backyard, environmental groups near the river, including the Buffalo Niagara RiverKeeper, began work to bring it back to a viable state. The RiverKeeper helped to start the Buffalo River Restoration Partnership, which includes Honeywell and governmental agencies like the New York State Department of Environmental Conservation, U.S. Army Corps of Engineers, U.S. Environmental Protection Agency and the New York State Department of Environmental Conservation. Much of the work to bring the Buffalo River back centers on a lengthy four-year dredging project that is scheduled to be completed in 2015. Members of the Partnership came together to encourage the work that is overseen by the U.S. EPA.