

Protecting water resources depends on data from water quality monitoring. Many entities and even private citizens engage in the monitoring of lakes, rivers, streams, and other bodies of water. In order to best decide where water quality measures are working and where problems from contamination or pollution are located, resource managers must use data these monitoring activities generate. However, without access to the data they collect and a good way to put it to use, that data is far less helpful.
WQData LIVE is the online portal for all NexSens telemetry systems and the water quality monitoring data they transmit. Data is pushed wirelessly into the database via cellular, satellite, or Wi-Fi. It can also be sent via Ethernet on a cabled connection.
In this post, we’ll cover how WQData LIVE works and what it offers, and explore some of the ways this kind of water quality data can be put to use.
WQData LIVE: Water Quality Data in Focus
The WQData LIVE portal and database were designed to work with telemetry-enabled NexSens water quality monitoring products. Data loggers connect automatically to WQData LIVE and transmit their data directly to the cloud where it is stored. From there, users can access it anywhere they have a mobile device or computer that’s online.
Users can even troubleshoot communications and configure settings without a site visit because with the WQData LIVE portal you can make configuration changes remotely using the system. Just queue up the changes online from any location, and the next time the system transmits, it will configure the remote data logger.
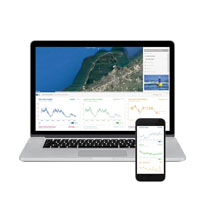
The first thing you see as you begin to use the system is its graphical dashboard. This dashboard offers a full summary of what’s on the site and functions as the primary user interface for the system. From there, it’s easy to view the map and choose the project site you’re interested in to view your data quickly as a series of graphs. Each site’s logger also has a system monitor with diagnostic data which assists in managing metadata.
WQData LIVE is simple to use at your desk, but you can use the portal to access your data anywhere thanks to its mobile-friendly design. There is no special software or application-specific hardware that you need to use WQData LIVE, so it works just as well on your tablet or smartphone, allowing you to troubleshoot, update settings, or just view sensor data from the field, from home, or anywhere you have an existing Wi-Fi network or direct link.
Depending on what your data reveals, you can use advanced mapping tools in WQData LIVE to display certain sites in high-resolution and pinpoint sites geographically. You can see each data logger’s status because site markers are color-coded, and your most recent data sets for each site pop up as you hover over the site markers.
WQData LIVE also allows you to see both live and historic data through an interface that is both intuitive and interactive. Choose the standard data plot display range that makes the most sense for your monitoring work, daily, weekly, monthly, or yearly. You can also get a closer look at the data by manually choosing a time frame. It’s easy to share your data, too, because the system allows you to download data tables.
Or, make notes on particular data points or add email alerts for when predefined thresholds are exceeded for certain parameters using WQData LIVE’s quick features. Your alerts will come to the most convenient place, whether it’s a mobile device or your computer, thanks to the system’s embedded cellular modem.
Putting Water Quality Data to Work
Water quality data allows decision makers the evidence they need to make informed policies in support of human and ecological health. It is the empirical evidence that supports environmental and public health advocacy. Here in the US, federal law in the form of the Clean Water Act and the Safe Drinking Water Act demands that good water quality data inform policymakers.
Monitoring water quality today, and collecting high-quality data, is challenging. This is partly because so many compounds used in commerce and in our homes can end up in water, and often the science on whether or not they are harmful lags behind their addition to watersheds. In fact, the means for analyzing toxicity exist for just a few thousand chemical compounds—but the US Environmental Protection Agency estimates that more than 80,000 are in commercial use.
Water quality data provides the basis for sound water management decisions in the form of objective evidence. Developing, managing, and storing water quality data online makes it far easier to work with, share, and use. Trends in water quality data alert users to a host of potentially dangerous problems, both ongoing and emerging, and highlight a range of beneficial uses for water from place to place. It just makes sense to be able to put that data to work, wherever you are.
The Bottom Line
There are countless reasons to collect water quality data, but without the ability to put it to work, its full potential isn’t realized. With the WQData LIVE portal, you get access to your data online, from anywhere. It’s shareable, sortable, and more usable all around—and you can even troubleshoot and configure your equipment on the fly through the portal.
To learn more about WQData LIVE, reach out to one of the Fondriest and NexSens team today. We’d love to show you just how much more you can glean from your water quality monitoring data.
Equipment
WQData LIVE is a web-based project management service that allows users 24/7 instant access to data collected from remote telemetry systems.
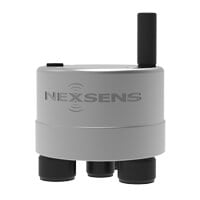
The X3 data logger offers the latest in real-time monitoring technology with wireless communication, a large plug-and-play sensor library, and ultra-low power consumption.
0 comments