
iChart does not offer a built in data manipulation option. In order to alter the data within iChart one can export the data to Excel, remove the iChart data, and re-import the altered data.
1. Open iChart with the current project file (.icr).
2. Click Help | Open Users Folder from the menu bar.
3. Open the folder named <ProjectFileName>.data. Leave this folder open for use in future steps.
4. Back in iChart, generate a new report by selecting Report | New Report.
5. Open the Report Tool panel if it is not already open by selecting View | Report Tools.
6. Under “Time Limit” select the Monthly box and select the month in which the misaligned data exists.
Note: An entire months worth of data must be exported at a time in order for this process to be successful.
7. Under “Include”, uncheck the Graph box and check the Data box.
8. Under “Time Resolution” select None.
9. Place a check mark next to the data logger in question and let iChart load the data before proceeding.
Note: Only ONE data logger can be changed at a time. If there are multiple loggers that need to be updated, they must be done individually.
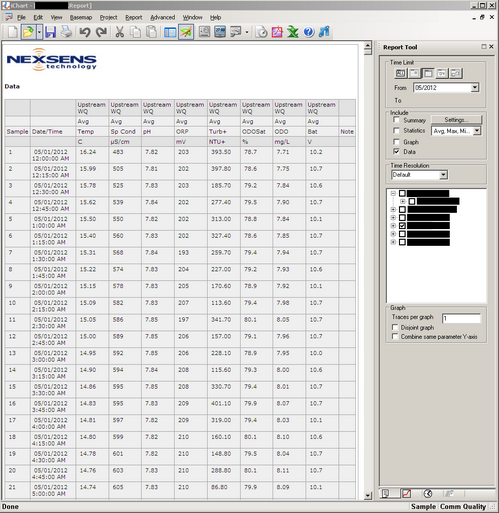
Figure 2: Report Setup
10. Select File | Export.
11. Specify a file name and location.
12. Close iChart.
13. Open the file you just exported from iChart using Excel.
14. Manipulate the data in Excel as desired.
Note: Do not change the overall formatting of the file or iChart will not be able to read the file later.
15. Save the file as a .csv file.
16. Navigate back to the <ProjectFileName>.data folder opened in Step 3.
17. Open the folder corresponding to the year folder which includes the data in question.
18. Re-name the month folder for the month in question as well as any month following the month in question to the following format.
- XX.bak
- EX: 06.bak, 07.bak
Note: If there is any data that exists after the month being edited it must have its name changed as iChart will only import “new” data. However, iChart will only see the data if it is in the standard naming convention, so changing the name makes the data invisible to iChart. Therefore, if there is a Year folder that comes after the month of data being manipulated, the entire Year’s folder must also be renamed (EX: 2014.bak).

Figure 3: Re-Name Data Folders
19. Open iChart with the current project file.
20. Select the site in question in the navigation panel.
21. Click File | Import.
22. Select the file created in step 15 and click Open.
23. Change any altered folder names back to their original names (i.e. remove the .bak added in Step 18) except for the month that was manipulated. This can be left unchanged in the data folder as a backup of the original data.
24. Generate a new report and ensure the data is displayed correctly.
REV: 13M19
I found one watchout with Time-Resolution. If you choose Time Resolution None, and for some reason there is empty data for a sensor for time periods, then the data shifts up to fill in the empty time periods, causing the data to be on the wrong dates. Time Resolution Default seems to handle this situation correctly.