
iChart provides several alerts and alarms that can be setup and used with iSIC data loggers.
iChart Alarm: Used to notify if parameters exceed pre-defined parameter limits. When data is received from the data logger, iChart sends an alarm.
Control Outputs: Used to control devices via 5V DIO (Digital Input/Output) or 12V switches. An iSIC data logger controls the device when it receives data from sensors that exceed pre-defined parameter limits.
iSIC-based iChart Alarm: Used to change the functionality of the data logger based on parameter inputs, like changing sample and log intervals based on a specific logged reading.
iChart Alarms
iChart software lets users create alarms when certain parameters go above or below designated values. This is useful when parameters need to be kept within a set range.
Available alarms include:
- Generate a sound through the computer speaker
- Flash a warning message on the computer screen
- Play a specified .wav file
- Send an email message
- Create a text file
- Send SMS messages to a cell phone
- Control a DIO port on a data logger
- Dial a phone
After an alarm is set, iChart checks to see if data values it receives exceed an alarm threshold. If so, an alarm will activate.
From the Navigation Panel, select the device for which an alarm is being set. Then go to Project | Setup iChart Alarm. The iChart Alarm window will appear.
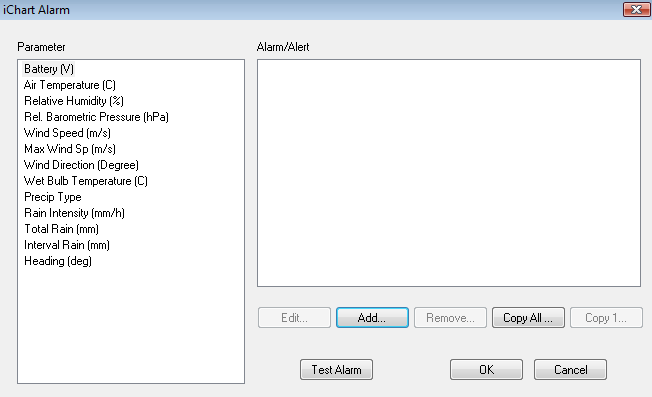
Figure 1: iChart Alarm window
Click Add to open the Define Alert/Alarm window.
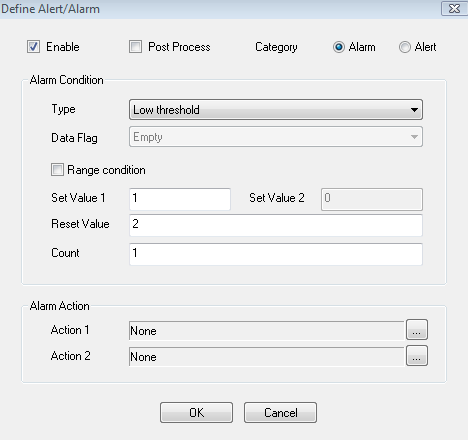
Figure 2: Define Alert/Alarm window
The Define Alert/Alarm window sets up a single alarm condition. To add multiple alarm conditions, click Add in the iChart Alarm window.
Check Enable to enable the alarm. After setting up an alarm, it can be stopped by unchecking this box. All alarm information will be saved.
Category specifies the kind of text used when an alarm occurs. Both Alarm and Alert selections function the same in iChart.
The alarm Type can be High Threshold, Low Threshold or Data Flag. Data Flag alarms are used to alarm at pre-defined data flag conditions. These flags are setup in the Project | Setup iChart Data Flag menu.
The Set Value is the value at which the alarm will trigger. For example, after clicking on Temperature C in the iChart Alarm window, entering 50 for Set Value 1 will mean an alarm will occur if the temperature goes above 50 C. The value can also be configured as a range. Check Range to enable this option and enter the top range as Set Value 2. It is possible to use a range alarm in conjunction with a set point alarm.
The Reset Value is the value at which the alarm will trigger again. For example, if an alarm was triggered at 50 C and the Reset Value was set to 45C, the alarm will occur when the temperature goes above 50 C and then only occur again when temperature drops below 45 C. This feature is meant to keep the alarm from being triggered repeatedly if, for example, the temperature goes above and below 50 C repeatedly.
The Count is the number of times the condition must occur before the alarm action will occur. The Count is based on the data logger sample interval. For example, if the sample interval is 5 minutes and the Count is 3, the alarm action will occur after 15 minutes of the alarm condition. This feature is useful to prevent irregular data spikes from triggering alarms, e.g. a turbidity value jumps due to a floating leaf.
After entering desired alarm conditions, go to the Alarm Action field. Click “…” The Alarm Action window will appear.
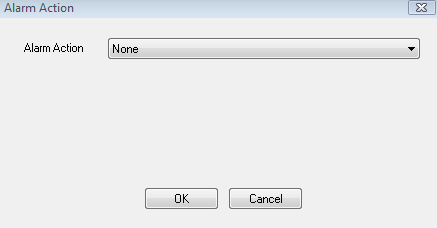
Figure 3: Alarm Action window
Click the drop-down list to select the Alarm Action that will be used. After making this selection, click OK.
Acknowledging an Alarm
When an alarm is triggered, the Alarm Toolbar icon will be displayed.
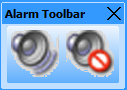
Figure 4: Alarm Toolbar
Click the left speaker to acknowledge the alarm. Click the right speaker (muted) to stop the alarm. If a Reset Value has been set, that alarm will still occur if triggered.
Sound PC Speaker
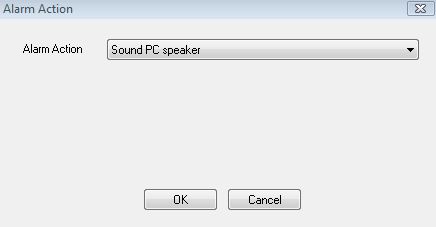
Figure 5: Sound PC Speaker
Selecting Sound PC Speaker will generate a continuous computer beep until the alarm is acknowledged.
Flash Message
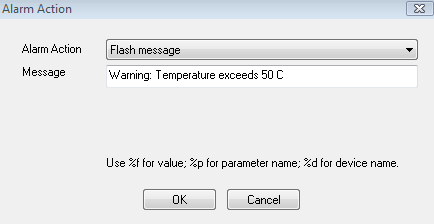
Figure 6: Flash message
Selecting Flash message will flash the message specified in the Message field until the alarm is acknowledged.
Play wave file
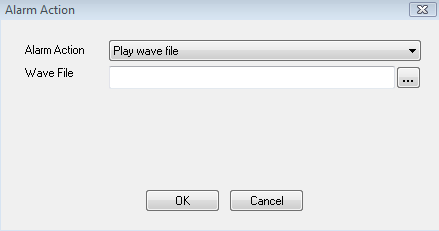
Figure 7: Play wave file
Selecting Play wave file will continuously play the chosen wave file until the alarm is acknowledged. Specify the wave file by clicking “…” box to the far right of the Wave File field. Several pre-configured wave files are located in iChart’s System folder.
Send an email message
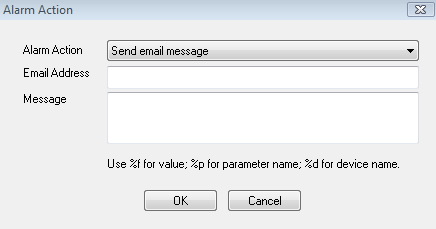
Figure 8: Send email message
Selecting Send email message will send an email to the specified email address in the Email Address field. The subject line of the email will be “ALERT” and the text entered into the Message field will be the email body. Note that email information must be set up for this alarm action to work.
Create a text file
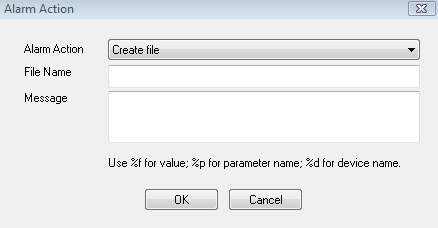
Figure 9: Create file
Selecting Create file will create a text file with the designated File Name and with the body text of the Message field. The .txt file will be saved in the iChart Program Files folder by default, but a filepath can also be entered in the File Name field.
Send SMS message
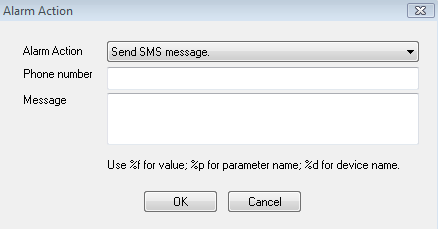
Figure 10: Send SMS message
Selecting Send SMS message sends a text message to the cell phone number designated in the Phone number field. In the Message field, enter what the text message will read. Note that using SMS messaging will require signing up for a paid service.
Pulse iSIC DIO
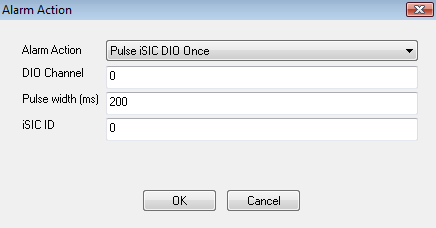
Figure 11: Pulse iSIC DIO
Selecting a Pulse iSIC DIO alarm – there are two options: single pulse and multiple pulses – lets iChart trigger a data logger to exercise control functionality. Implementing controls on a data logger based on a parameter is best done by setting up a Control Condition in Step 4 of the Setup Device Wizard. The advantage to this type of alarm is that it allows for controlling a data logger based on a parameter measured in another location. For example, an upstream site could detect a high amount of turbidity – using this alarm, a sampler can be started downstream. In iChart’s Navigation Panel, note the number in the bracket next to the data logger for which the alarm applies. Enter the number in the iSIC ID field, e.g. “1” would be entered for “3100-iSIC[1]”.
Dial phone
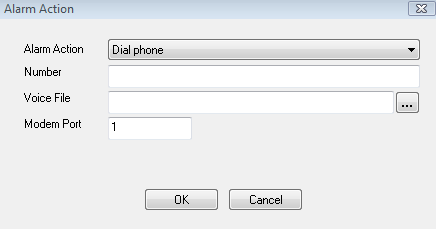
Figure 12: Dial phone
Selecting Dial phone will dial the phone number designated in the Number field. In the Voice File field, a file may be assigned to play by clicking “…” and the Modem Port field supports assigning a modem.
REV: 13C26