
Adjust Parameter Display Settings
The display of parameter values on a project Dashboard is highly customizable. In the Parameter Settings menu, selections are available to modify parameter names, choose which parameters to display, convert display units and precision for individual parameters, set automatic filter values, and more.
To adjust the parameter display settings:
- Click on the ADMIN tab and then Settings located at the top of the Dashboard.
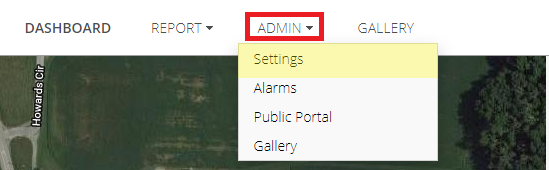
Figure 1: ADMIN | Settings menu on Project Dashboard.
- Select the Parameters Settings tab. A drop-down menu will appear with each site name. Choose the site and data logger that contains the desired parameter.
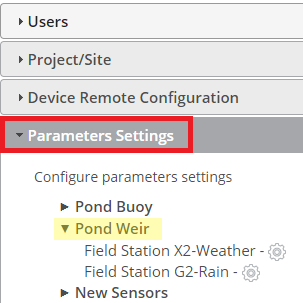
Figure 2: Click Parameters Settings.
- Once the site is selected, choose a data logger to update its parameter settings. The Parameter Settings for the logger will open in a pop-up menu.
Parameter Settings Options
- The Data Range option allows configuring of the default time span for viewing of parameter data in Dashboard graphs. The available options show either all of the data points from the current day or previous 24 hours.
- The Sensor and Parameter area lists the parameters for each individual sensor and includes the following display settings:
- Show/Hide: Allows the user to show or hide individual parameters.
- Hiding a parameter will remove the data display from the default site Dashboard.
- The logger will continue to record the parameter, and the data values can be unhidden at any time.
- Parameter Names: Edit the text next to the “Show/Hide” option to change parameter names.
- Default parameter names are automatically assigned during the WQData LIVE setup according to the sensor type.
- Conversion Factors: Converts measurements to different units.
- WQData LIVE contains multiple conversion factors for units output commonly by environmental sensors.
- Unit names can also be edited, but the data values will be converted based on the units selected from the predefined drop-down list.
- Note: The alerts or alarms will be based off of the original unit uploaded to WQData LIVE. Thus, for any unit converted on WQData LIVE, a manual conversion back to the original unit is necessary to enter an accurate threshold in the alarm settings.
- Precision: Changes the displayed precision of each data point.
- Default precision will vary based on the measurement type and sensor specifications.
- WQData LIVE allows up to 6 values after the decimal point.
- Filter: Set minimum and maximum values for the parameter graphs and choose the filter option by checking the box. This will completely remove the outliers from the parameter graphs.
- Map: Checking the box enables visual display of a parameter on the Project and Site maps.
- Show/Hide: Allows the user to show or hide individual parameters.

Figure 3: Sensor And Parameter tab in the project settings.
- To apply changes, click SAVE at the bottom of the screen.