
Ocean waves are powerful, and in some situations can destroy structures and harm people. Understanding how waves are generated and predicting their path and size is a long-standing human necessity.
In open water, depending on the weather, you might find tides, wind waves, or even tsunamis. But it is waves generated by the wind rushing over the surface of the water, that are the subject of the most monitoring and measurement efforts.
In this post, we’ll be looking at how wave statistics are calculated, and the types of equipment used to perform buoy-based wave measurements.
How Waves are Formed
Different things, from boats to the moon’s gravity to earthquakes and other extreme weather, can produce waves in oceans and large lakes. However, the main cause is the friction between the surface of the water and winds that sweep across it. The interplay of this friction and the pull of Earth’s gravity result in waves.
Waves with shorter periods that exist close to where they formed are called seas. Waves that form in one place and travel a distance, developing a longer period, are called swells. Although seas are inextricably linked to atmospheric influences such as gravity, swells can travel a long way without losing much energy until they finally dissipate near the shore or in shallow waters.
Swells of any real size are a feature of oceans, not lakes, as smaller bodies of water lack the distance (fetch) and energy to generate them. In deep waters offshore, four factors determine how large waves driven by wind become: wind strength, wind duration, fetch, and whether or not the waves break. These are complex, interactive forces, so predicting the properties of waves is complicated, and a fertile area for researchers.
Why Researchers Need Wave Measurements
Waves travel what are often very long distances, and can contain high levels of energy. These qualities alone mean that they have the potential to impact many facets of human life. Waves can affect the ability of boats to navigate, or of people to make use of shorelines. They can even destroy settlements on the water, change how people eat or live in certain regions, and remodel the very shape of the shoreline.
There are also critical yet less apparent secondary wave effects that both scientists and policymakers must be aware of. For example, waves might enhance the exchange of air and sea gases, affect the mixing of surface water, generate currents along the coast, and re-suspend sediments, affecting transport particles and water quality. And while we typically think of extreme weather as discrete events, waves can cause permanent harm during even seasonal, expected storms like nor’easters, making accurate prediction of wave movement essential.
Taking Buoy-based Wave Measurements
Traditionally, radar has been the method used to measure surface currents and waves when coverage of large surfaces is the goal. A broad range of technologies fit into this category, such as shore-based, high-frequency radar arrays; microwave; navigational radars; and aircraft- or satellite-based synthetic aperture radar.
However, while each of these types of radar technology can provide a glimpse of the “bigger picture,” they cannot offer the detailed data that buoy-based spot measurements provide. Buoy-based measurements also allow you to collect information on other parameters related to broader concerns, such as algae, currents, oxygen, pCO2, particles, salinity, temperature, and wind.
To calculate wave data, a system must achieve several aims. It must: analyze and report time-domain wave height and wave period statistics; it must conduct a non-directional spectral analysis and report frequency domain wave height and wave period statistics, and it must engage in directional spectral analysis to report frequency domain wave speed and wave direction data. In practice, there is more than one way to get this information.
To compute zero-crossing parameters, the system will note the locations of interim wave peaks and downward zero-crossings, while adjusting for noise. To compute non-directional wave parameters, the system will use captured data on heave motion and spectral moments in the frequency domain and statistics, a more noise-resistant process.
To compute directional wave parameters, the system will use both angular motion data and surface elevation data in the frequency domain. More specifically, it will measure the correlation between slopes of the north-south and east-west angles and the heave data series, and then calculate directional coefficients from a limited Fourier Series to estimate directional spectra based on the correlations. Finally, using established methods, the system refines the coefficients further to produce mean wave speed and direction for the data set.
The principles of systems used to take buoy-based wave measurements work as follows. First, pressure based sensors are deployed beneath the water in fixed, mounted locations. This way, the system can measure water level and sample non-directional waves in bursts. As pressure at the water’s surface generates perturbation, the pressure based sensor measures it, subject to how attenuated the originating pressure is. The more attenuated the pressure is, the smaller the wavelength of the perturbation, and more challenging it is for the sensor to register the motion. Coupled with high frequency acoustic current measurements (PUV method), these pressure based sensors can measure directional waves, and they may also be used in time-synchronized arrays to the same end.
To take acoustic wave measurements, an acoustic doppler current profiler (ADCP) is deployed in a fixed underwater location. This device measures the waves’ orbital velocity at a set point from the water’s surface to calculate wave parameters. For short waves this method is limited, as it is dependent upon installation depth, although ADCPs do allow you to capture other information about the current, such as water flow.
In more recent times, directional wave buoys equipped with accelerometers and GPS have been used to take wave measurements—at a much higher cost. Today, although there are more cost-effective GPS based technologies, these also tend to demand more power. These units also carry greater risk should they become lost or damaged. However, for many applications, accelerometer-based wave measurements are the “gold standard.”
Finding the Right Buoy-based Wave Measurement Solution
Many buoy-based wave measurements are performed using inertial-based sensors. NexSens offers the SVS-603 wave sensor for this purpose. To learn more about how the SVS-603 calculates wave statistics using an accelerometer and compass values, see our manual here. Or, to learn about other buoy-based wave measurement solutions, reach out to our knowledgeable team today.
Equipment
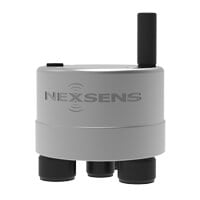
The X3 is an all-in-one environmental data logger designed for both pole/wall mount and buoy-based applications. Compatible sensors include water quality instruments, temperature strings, ADCP’s, water level sensors, and weather stations.
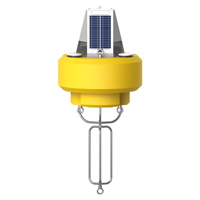
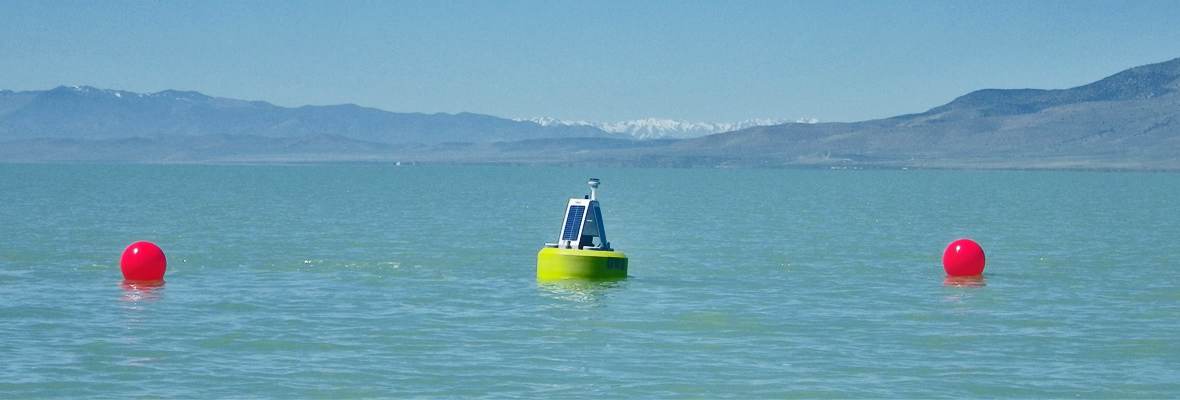
The NexSens CB-450 Data Buoy is designed for deployment in lakes, rivers, coastal waters, harbors, estuaries and other freshwater or marine environments.
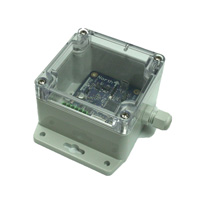
The SVS-603 Wave Sensor is a highly accurate MEMS-based sensor that reports heading, wave height, wave period and wave direction via RS-232 or logs to its on-board data logger.
WQData LIVE is a web-based project management service that allows users 24/7 instant access to data collected from remote telemetry systems.
I would like to inquire about this product Nexsens CB-450. We would like to conduct water wave analysis in Laguna Lake, Philippines. Can you send to me a quote for one unit and availability during this pandemic?