
Data marking allows a user to exclude bad data from being displayed in a report or have it show up in a different color.
1. Open the current project file.
2. Generate a new report or open an existing report.
3. Click Project | Data Marking.

Figure 1: Project | Data Marking
4. Select the Month for the data in question from the top calendar.
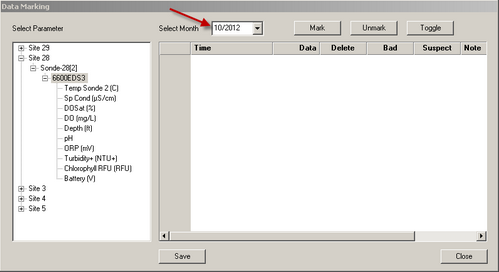
Figure 2: Month Selection
5. Expand the file tree on the left to display the individual parameters for the sensor that has the parameter with bad data.
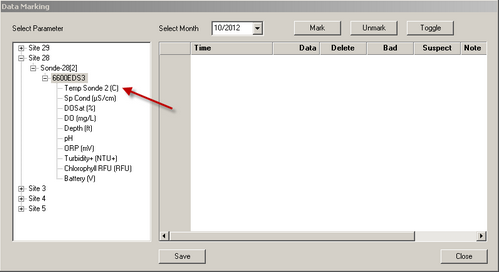
Figure 3: Expand the File Tree
6. Select the parameter in question.
7. Mark the data as Delete, Bad, or Suspect
- Delete: excludes the data from the report.
- Bad & Suspect: leave the data in the report, but changes the Graph line color to pink
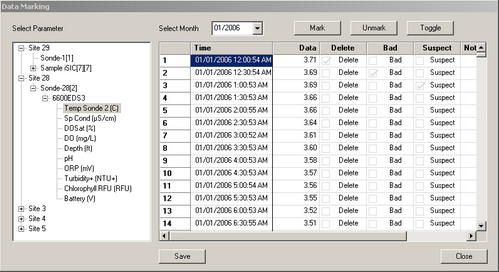
Figure 4: Data Marked
8. When done click Save.
9. When prompted “Are you sure you want to save the marking data?” click Yes.
10. Click OK on the confirmation dialog that appears.
11. Click Close.
REV: 13G19