
This document contains step by step instructions on setting up an iChart report to automatically post data to the NOAA National Data Buoy Center (NDBC) database. Before data can be posted to the NDBC, please contact NOAA to get a site ID assigned to the monitoring site and to obtain ftp credentials for sending data to the NDBC web site.
1. Create a new report by selecting Report | New Report… from the iChart menu.

Figure 1: New Report
2. Open the Report | Other Setup… menu.
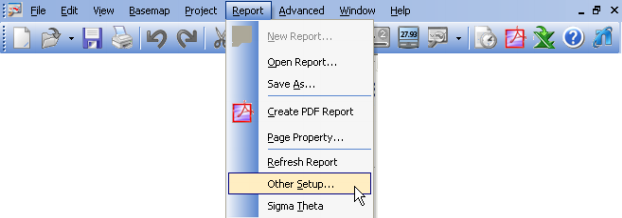
Figure 2: Other Setup
3. Click the Misc tab on Report Other Setup window, select Interval and click Close.
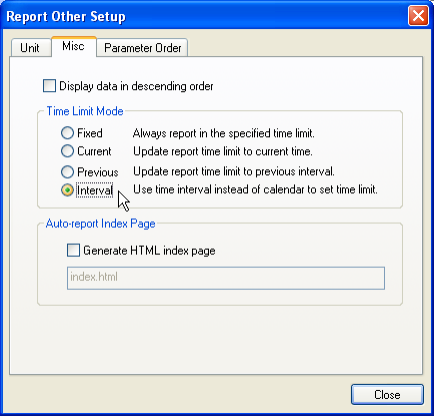
Figure 3: Misc. Tab
4. On the Report Tool main page:
- Under Time Limit, click the Custom button and enter the From and To time so that the interval is 1 minute less than twice the log interval. For example, if the log interval is 1 hour, then set the From time to “01/01/2012 12:00AM” and To time to “01/01/2012 1:59AM”.
Note: The exact date and time is not important.
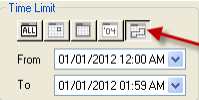
Figure 4: Custom Button
- Under Include, check only the Data box
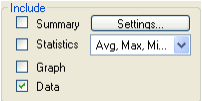
Figure 5: Select Data Box
- Under Time Resolution, select Default. Note that if the default time does not match the log interval, UserDefined must be selected and the number of minutes of the log interval entered into the field.
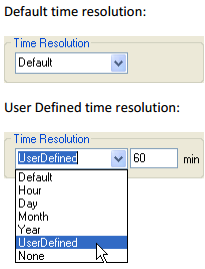
Figure 6: Default vs. User Defined Time Resolution
- From the project tree, select the parameters to be reported. Only parameters in the following table will be accepted by the NDBC:
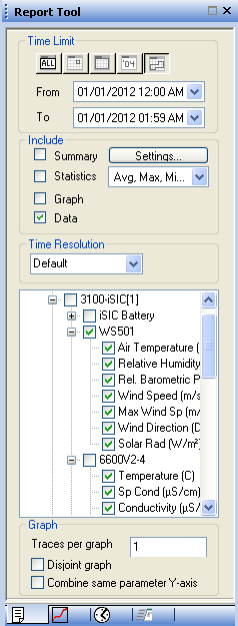
Figure 7: Sample of the Final Main Report Tool Bar Setup
5. NDBC will only accept the units listed in the above table. If certain units need to be changed, follow
these sub-steps:
- Go to Report | Other Setup … and view the Unit tab (see Step 3).
- Select a parameter.
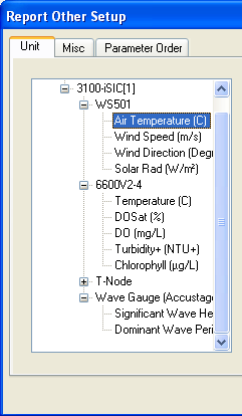
Figure 8: Report Other Setup
- Select the correct unit from the dropbox on the right.
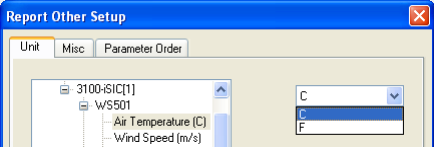
Figure 9: Select Units
- Change as many units as required for the report to be NDBC compatible.
- Once done, press the Close button.
6. Return to the Report Tool and click the Schedule page button (clock icon at the bottom of the Report
Tool) to select schedule setup.
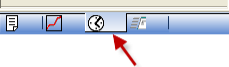
Figure 10: Schedule Page
7. On the Report Tool Schedule page:
- Check the Enable Auto Report box
- Under Destination, select FTP. Enter “comms.ndbc.noaa.gov” for the URL. The login and password are the FTP user name and password provided by the NDBC.
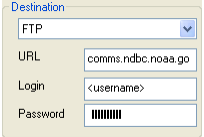
Figure 11: Destination
- Under Format, select NDBC XML and click the browse button “…” to bring up the NDBC Setup screen.
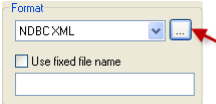
Figure 12: Browse Button
- On the NDBC Setup window, enter the Station ID provided by the NDBC and customize the tags as needed. Note that the NDBC tags are automatically assigned for standard parameters.
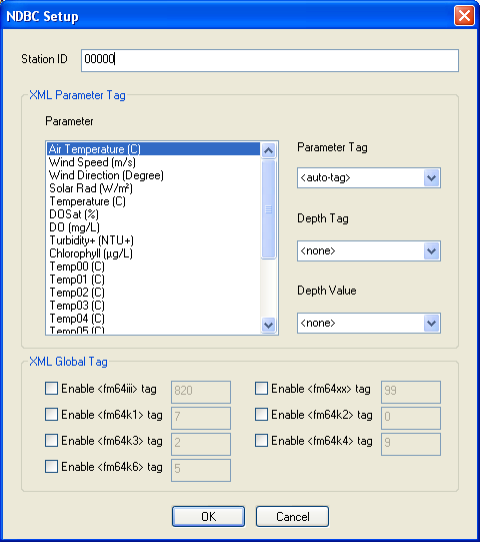
Figure 13: NDBC Setup Window
- Optionally, the Depth and Depth Value tags are used to specify the depth where the sensor is installed. All values can be picked from the drop-down list or typed in the box if the correct value is not listed.
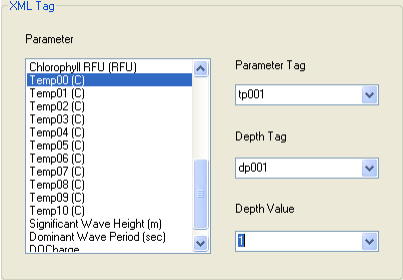
Figure 14: Select Depth Values
- If you are measuring any or a combination of the following: salinity, water temperature, and/or current, please enable the following check boxes and enter the correct value for each of them.
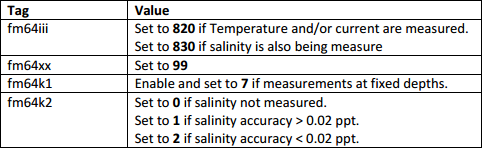
Figure 15: Values for Water Temp., Salinity, and/or Current
- In the Auto Report Schedule section, click the Day drop-down list and check each day from Sun to Sat.
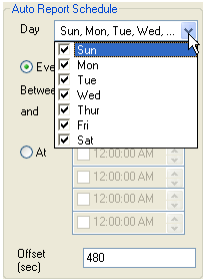
Figure 16: Auto Report Scheduling
- Check the Every box and enter the log interval. Enter the offset value in seconds. Note that the interrogation should be set to match the log interval so that data is uploaded as soon as it is collected. The NDBC posting offset needs to be set to the interrogation offset plus the time it takes to upload the data. For example, if the log interval is 1 hour, it takes 5 minutes to acquire data and 2 minutes to upload data, then the interrogation offset should be 360 seconds (6 minutes) and the NDBC posting offset 480 seconds (8 minutes).
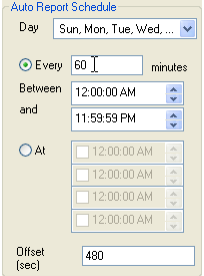
Figure 17: Sample Auto Report Schedule
8. Click the Report | Save As… menu and enter a name to save. Beginning the file name with ndbc_ is recommended but not required.
Note: The report must remain open at all times during the project in order for data to be sent to the NDBC database.
9. If the Auto-Report is properly configured and FTP is not successful, consider enabling Passive FTP in iChart as this may circumvent firewall issues from blocking the transfer. Additional information on this Passive FTP setting can be found here. After applying the change, it is possible to manually send data in iChart by navigating to File|Send to| FTP.
REV: 13G30