
System Setup
Located in Edit | Preferences.
General
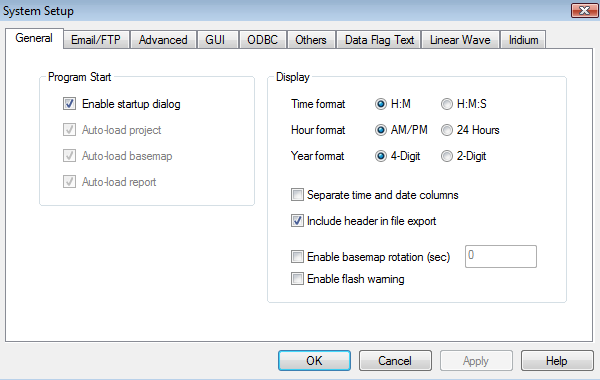
Figure 1: General Tab
Program Start
Enable startup dialog – Enables the Open Choice Dialog window to open upon iChart6 startup.
This item is checked by default. From the Open Choice Dialog window you can select how you
want iChart6 to open every time it opens.
Auto-load project – This option is only available if the Enable open choice dialog box is
unchecked. iChart will open the last project used upon iChart 6 startup.
Auto load basemap – This option is only available if the Enable open choice dialog box is
unchecked. iChart will open the last project used and open to the basemap view upon iChart6
startup.
Auto-load basemap – The basemap feature has been disabled in iChart 6.
Auto-load report – This option is only available if the Enable open choice dialog box is
unchecked. iChart will open the last project used and open to the last report made upon iChart6
startup.
Display
Time format – The format selected here will change the format everywhere it is seen in
Instrument Control screen. This format will not, however, affect the way time is seen in
reports. Select H:M to display hours:minutes, and selected H:M:S to display
hours:minutes:seconds. Hour and Year formatting options are also available.
Enable basemap rotation – The basemap feature has been disabled in iChart 6.
Enable flash warning – Enables the Auto Interrogation Failed warning window to display
whenever an auto-interrogation fails. This box is checked by default. Disable auto
interrogations from the Setup menu in the main Instrument Control screen.

Figure 2: Email/FTP tab
MAPI – Sets iChart to use MAPI email protocol whenever it needs to use email, for example when iChart automatically sends reports via email. The email options will need to be setup in their respective menus. Contact a system administrator or email service provider for information regarding which protocol should be used.
SMTP – Sets iChart to use SMTP email protocol whenever it needs to use email, for example when iChart automatically sends reports via email. The email options will need to be setup in their respective menus. Contact a system administrator or email service provider for information regarding which protocol should be used.
Advanced
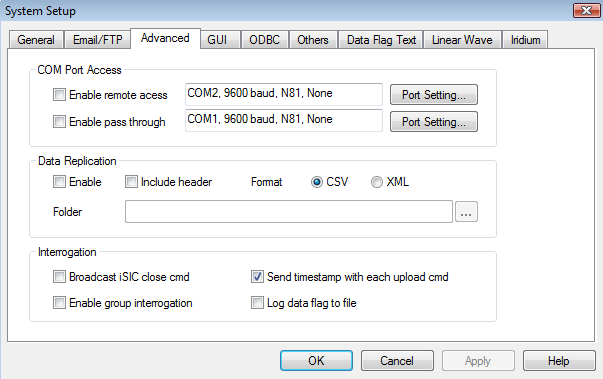
Figure 3: Advanced tab
COM Port Access
Enable remote access – allows for interfacing iChart remotely via COM port.
Enable pass through – allows interfacing iChart using pass-through mode via COM port.
Data Replication
Enable – Enabling Data Replication allows for saving data in CSV (Microsoft Excel) format. iChart will always save data in an iChart database files located in C:/Program Files/Nexsens/iChart6/Users/<iChart database file name>.Data.
Include header – when using saving in another specified format, iChart can save the header
information of that data in the new format.
Format – This option allows for selecting the format that in which data will be saved.
Folder – This option allows for specifying the folder in which data will be saved.
Interrogation
Broadcast iSIC close cmd – This option is for backwards compatibility. Use only when instructed by Nexsens Technology Customer Support.
Enable Group Interrogation – In order for group interrogation to work, this box must be checked. This is not checked by default.
Send timestamp with each upload cmd – This option lets data timestamps be removed from data logger data streams. It is mostly used in advanced troubleshooting.
Log data flag to file – This option is used in advanced troubleshooting. Use only after instruction from NexSens Technology Customer Support.
GUI
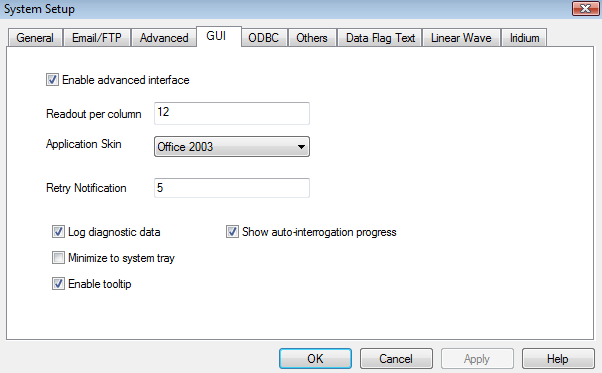
Figure 4: GUI tab
Enable Advanced Interface – This checkbox allows the user to enable or disable advanced interface options. Many of these are located in Advanced in the menu bar.
Readout per column – This option affects the number of devices shown in the main Instrument Control screen per column. The value in this box does not directly correlate to the actual number of devices shown, as iChart automatically evens each column so that they align evenly.
Application Skin – This option allows for selecting the type of windows theme iChart will display. Note that some theme options may be affected by other settings within the main operating system.
Retry Notification – Number of times iChart will retry communicating to a device before it will change the instrument screen time to the color red to signify the failed connection.
Log Diagnostic Data – This checkbox allows the user to enable or disable logging diagnostic data.
Minimize to System Tray – When checked, iChart 6 will be displayed only in the system tray when minimized.
Show auto-interrogation progress – This option enables a window to show the progress of auto-interrogation.
Enable Tooltip – This option show popup boxes to help users know what different buttons do.
ODBC
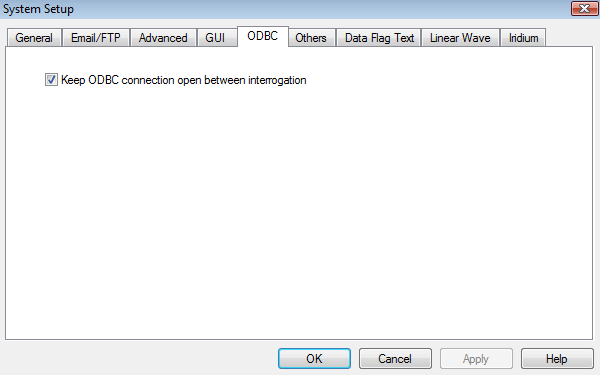
Figure 5: ODBC Tab
Keep ODBC connection open between interrogation – This option keeps the ODBC connection open in between interrogations.
Others
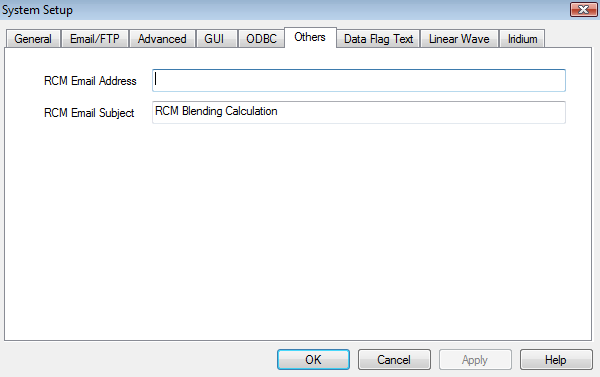
Figure 6: Others tab
RCM Email Address – Enter an RCM email address in this box.
RCM Email Subject – This will be the subject line of the email.
Data Flag Text
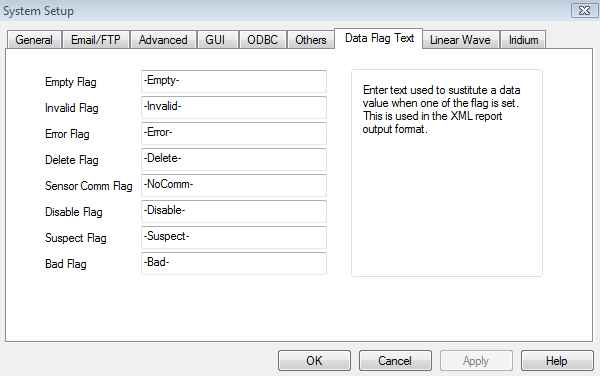
Figure 7: Data Flag Text tab
In this tab, enter text that will be used to substitute a data value when one of the available data flags is set. These data flags can be seen by clicking Project | Data Marking.
Linear Wave
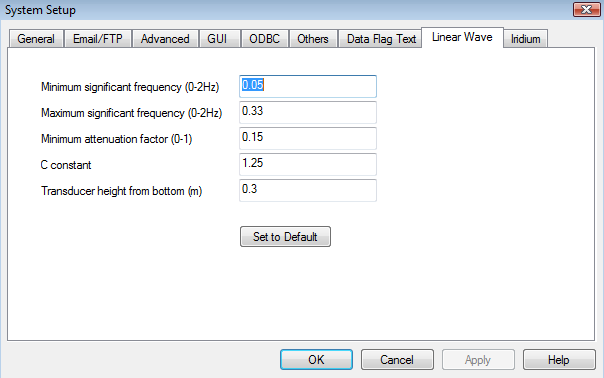
Figure 8: Linear Wave
This tab is used in wave modeling applications. Contact NexSens Customer Support for more information.
Iridium

Figure 9: Iridium tab
The Iridium tab is used to setup an alternate email address for Iridium Satellite telemetry data logger options. This is an advanced feature. Contact NexSens Customer Support for more information.
Page Property
Page Property allows users to setup features such as the paper size and other paper options. These features do not become displayed in iChart and will only affect printing options. A report will need to be open in order to change page property. These changes only affect the report that is open. To modify more than one report, each one will need to be changed individually. Click Report | Page Property to access this menu.
General Tab
Margin – iChart will set margins to user specifications. These should be chosen based on the best resolution for printing.
Page Break – When in html view, iChart will automatically insert page breaks after certain events, as specified. Using page breaks allows users to keep sections of reports on individual pages, and generally makes the report look better. All page break options are enabled by default.
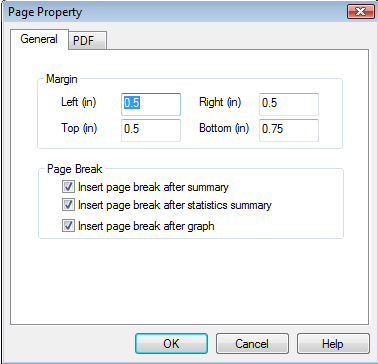
Figure 10: General tab in Page Property
PDF Tab
Page
Size – This option is for selecting the appropriate size of printing paper used to print reports. It should be the actual size of the paper being used.
Width / Height – If Custom is selected from the Size drop down menu, users may enter actual Width and Height of the paper used to print the report.
Page Orientation – Allows for selecting the orientation in which the report pages will be printed.
Font
Scale – Allows users to scale up or scale down the font size within a PDF report by entering a magnification percentage.
Y-Axis Scale Orientation – Sets the orientation of the Y-Axis scale labels on graphs generated in the report.
Field Note
The field note field is located in every report generated by the current database, as long as Summary is checked to be displayed. This feature cannot be used when a report is open. This is located in Project | Add Field Note…
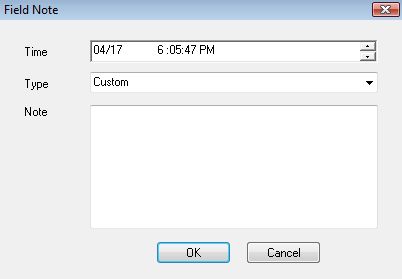
Figure 11: Field Note
Time – The time to be displayed for the note.
Type – The type of note to be displayed. There are many pre-made notes to insert. Create one by selecting Custom.
Note – The text to be displayed for the note.
Manually Sending Automatic Data
Click File | Send To to send iChart data to other programs locations. Options include Mail Recipient, FTP, Folder, and Excel.
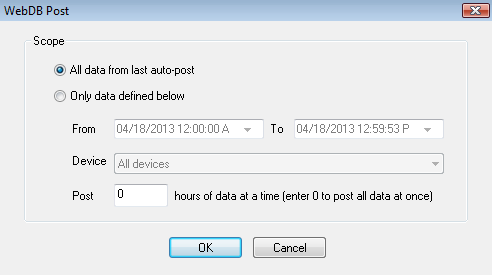
Figure 12: WQData Post
Selecting File | WQData LIVE | Repost Data allows you to manually post data to your WQDataLIVE.com website.
All data from last auto-post – will manually post data from the last time iChart posted data.
Only data defined below – will manually post data from the data specified in the From field to
the date specified in the To field.
A selection from the Device drop down menu must be chosen to pick which devices to post data from.
A number of hours of data to be posted can be chosen in the Post text box. Click OK when finished.
REV: 15D28