
Data flags can be used in iChart to filter data before it is saved. Note that using this feature will cause data to be filtered before it enters the iChart database and the filtered data won’t be retrievable. Data can also be filtered after it has been saved and processed using iChart report tools.
To set up data filtering, open the current iChart project file and click Project | Setup iChart Data Flag. The iChart Data Flag window will appear.

Figure 1: iChart Data Flag window
Select the parameter for which a data flag will be set. Note that Battery (V) is used only as an example. Click Add. The Define Data Flag window will open.
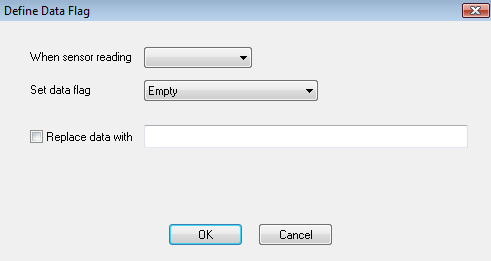
Figure 2: Define Data Flag window
The Set data flag field is the text value that will replace sensor readings in collected data. Options include:
- Empty
- Invalid
- Error
- Delete
- No sensor communication
- Suspect
- Bad
The When sensor reading field is the condition that controls when a data flag will be set. Options include:
- is equal
- is not equal
- is less than
- is greater than
- is greater than (A)
- is greater than (O)
Check Replace data with to set up a custom description. Click OK.
Note: the value -100000 means the iSIC data logger was unable to communicate to a sensor connected to it. Note that the value returned from the iSIC is not exactly -100,000. Thus, to compare to this value, use greater than AND less than logic.
REV: 13G05