
If rain data has been collected in daily periods (Daily Rain), the iChart Report Tool may be used to generate a Total Monthly Rain report.
1. In the current iChart project file, click Report | New Report. The Report Tool will appear.
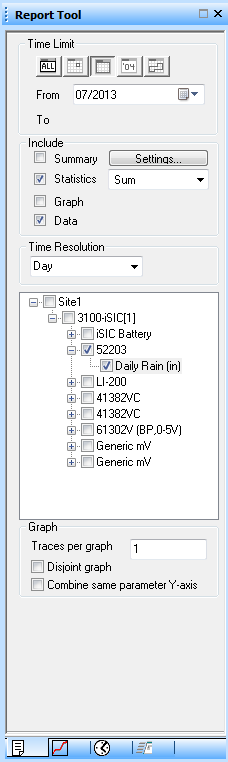
Figure 1: Report Tool
2. In the Time Limit section, select Monthly and specify the month for which data is needed.
3. Within the Include section, check Statistics and Data.
- Note that “Sum” must be selected in the Statistics dropdown.
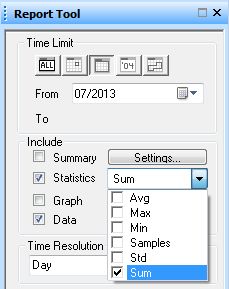
Figure 2: Check “Sum” in Statistics Dropdown
4. In the Time Resolution dropdown, select Day.
5. Expand the site and place a check beside the Daily Rain parameter. Data for that parameter should come into the report window.
6. Navigate to the Advanced tab of the Report Tool (at bottom, 4th tab from left).
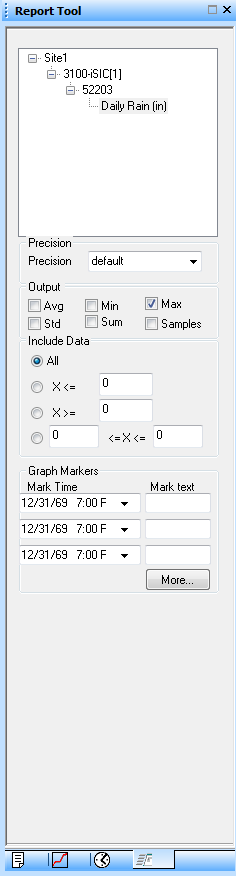
Figure 3: In the Output section, place a check mark in Max
7. In the Output section, place a check mark in “Max”. This will show the maximum amount of rain collected per day for the month selected in the report window. Refer to Total in the Statistical Summary for the total monthly rain.
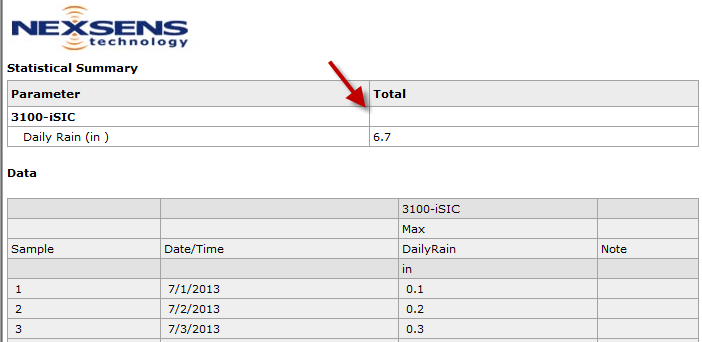
Figure 4: Total Monthly Rain calculated by adding daily maximum rain data points for one month, shown in report window
REV: 13J17