
X2 Diagnostics
The X2 Diagnostics utility in CONNECT software enables users to perform the following functions:
- Read the logger’s diagnostic sensor suite
- Toggle sensor port power on/off
- Enable/disable on-board Wi-Fi
Access X2 Diagnostic Utility
- Connect the X2 logger to a PC and launch the CONNECT software. Test connection by reading the RTC clock of the logger in the CONFIG tab.
- Navigate to Tool | X2 Diagnostic.
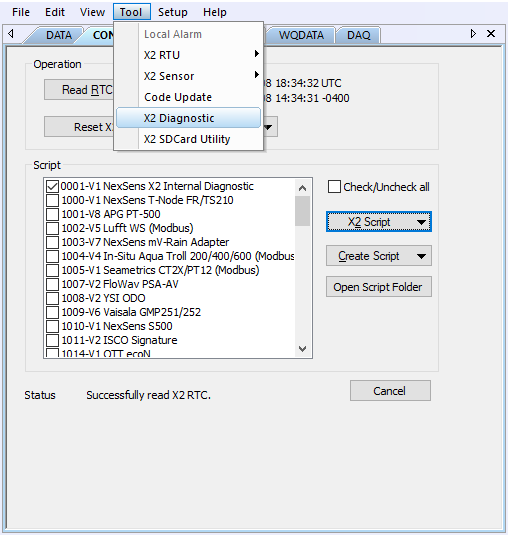
Figure 1: Navigate to Tool | X2 Diagnostic.
- The X2 Diagnostic menu will appear.
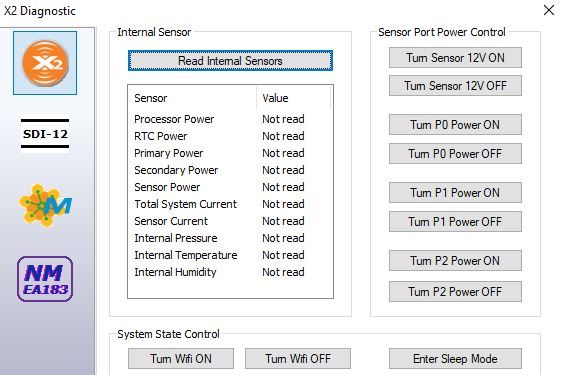
Figure 2: X2 Diagnostic window.
Read Internal Logger Diagnostics
- Click the Read Internal Sensor button. This initiates a live reading of the logger diagnostic parameters.
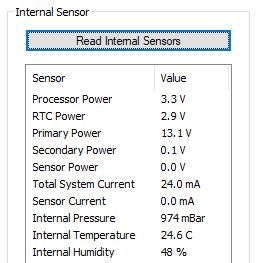
Figure 3: Read diagnostic values.
- Note that the Sensor Power parameter will read 0V unless:
- The X2 has been configured to log data from a full-time power sensor.
- Sensor 12V power is manually switched on (see next section).
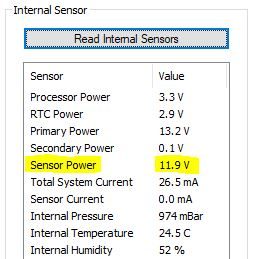
Figure 4: X2 sensor power.
Toggle Sensor Port Power
By default, the X2 will not apply 12V power to any of its sensor ports outside of a scheduled reading or an autodetection process. However, manually switching on 12V power is possible.
- Locate the set of ‘Master’ switch power port controls in the top right corner of the X2 Diagnostic menu.
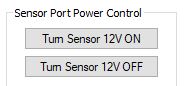
Figure 5: X2 Sensor Port Power Control buttons.
- Select the Turn Sensor 12V ON option.
- Next, select the appropriate Turn Px Power On button for the sensor port in question.
- Perform the troubleshooting or testing necessary on the port and click the Turn Px Power Off button to shut off power.
- Before exiting CONNECT, turn off the master port power switch by selecting the Turn Sensor 12V OFF button.
Toggle Wi-Fi On/Off
- Locate the System State Control section of the X2 Diagnostic menu.
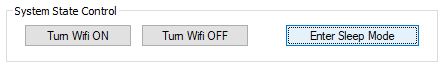
Figure 6: System State Control submenu.
- Select Turn Wifi ON to power up the X2 logger’s Wi-Fi module.
- Complete any required Embedded Web functions with the X2 data logger and click Turn Wifi OFF.