
Performing a Measurement System Power Budget
Analyzing a measurement system power budget is a useful practice to help ensure that a proposed system design will meet the monitoring objectives and reliably deliver data. To aid with this, NexSens has developed a power budget tool which can quickly estimate the expected power performance of systems using the most common NexSens buoy platforms, data logger configurations, and commonly integrated NexSens and third-party sensors for deployment locations throughout the world.
The power budget tool receives frequent updats with site locations, sensor types and other information. Contact a NexSens applications engineer to request an up-to-date copy:
Instructions for Use
- Begin by entering the company and/or project name and date in the top section. It is recommended to save the file with a unique identifier before proceeding past this point.
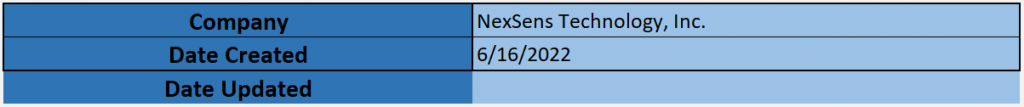
Figure 1: Project information header.
- Proceed to enter basic information about the system – equipment type (logger and hardware), telemetry option (if any), sample and transmit intervals, and extra battery if used.
- The example below shows a CB-950 data buoy with X2 data logger and CB-A05-3 battery pack with (3) 28 A-hr batteries. The system will sample every 20 minutes and transmit all data every 60 minutes and has no additional batteries connected (as is normal on buoy-based systems).

Figure 2: Enter system information.
- Proceed to select the relevant sensors from the predefined sensor list (drop-down menu in Sensor column). Select the quantity of each sensor type and whether they will use full power, switch power or internal power.
- The example below shows an Airmar 200WX-IPX7 weather station, NexSens T-Node FR temperature string with 10 nodes, Nortek Signature 1000 current profiler, and a YSI EXO3 sonde all on switch power.
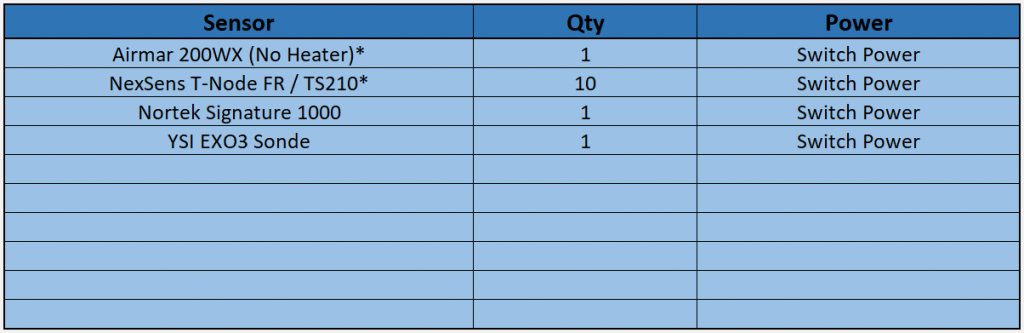
Figure 3: Select sensors from drop-down list.
-
- While the pre-populated sensor list is fairly extensive and frequently updated, it does not list all compatible sensors. In such cases, it is possible to enter up to four devices manually by selecting Custom 1/2/3/4 from the drop-down list.
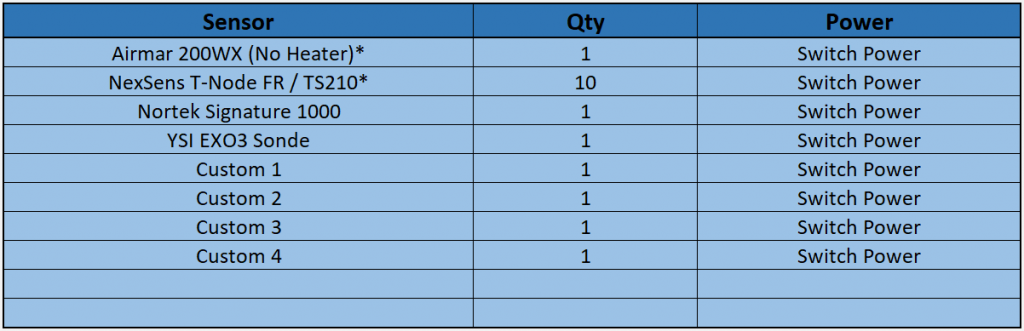
Figure 4: Custom sensor entry.
-
- Once selected, proceed to the Custom User Entry tab of the spreadsheet. Then, navigate to the Sensor Details section. Fill in the prompted information either using data from the device manufacturer or measured data during device testing.

Figure 5: Custom sensor data entry.
-
- Note that some instrument types have a number of different configurations which may affect power performance. The predefined sensors in the drop-down list reflect a typical configuration and information provided by the manufacturer or NexSens bench testing where applicable. These therefore represent a best approximation based on available information. However, it is possible to edit manually in the Sensor Details section of the Power Budget Calculation tab if more precise information is available.
- After entering all sensor information, select a deployment location from the drop-down list. The predefined list contains locations throughout the world. It is normally sufficient to select the closest possible location provided that the latitude and general climate conditions are similar. However, if an appropriate location is not available, contact NexSens as new locations can normally be added quickly upon request.
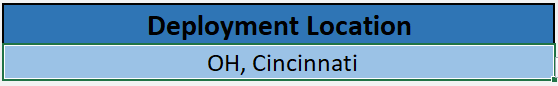
Figure 6: Select deployment location.
- Select the expected months of the year for system deployment. In many cases, all months will be selected, and December will be the limiting month for sites in the northern hemisphere. However, this option is available because, particularly for data buoy systems, some applications require only seasonal or short-term deployment.
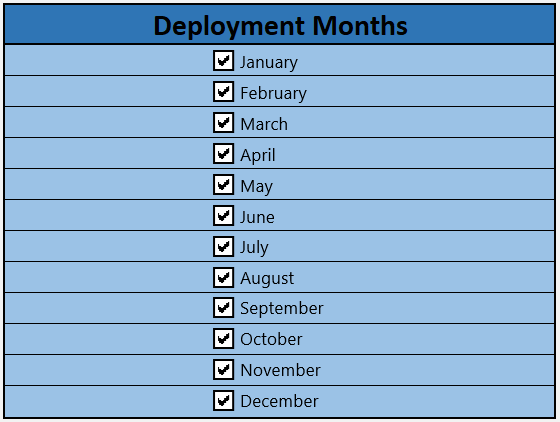
Figure 7: Select months of active deployment.
- Having entered all equipment information and deployment site conditions, the Results section will now display the calculated results.
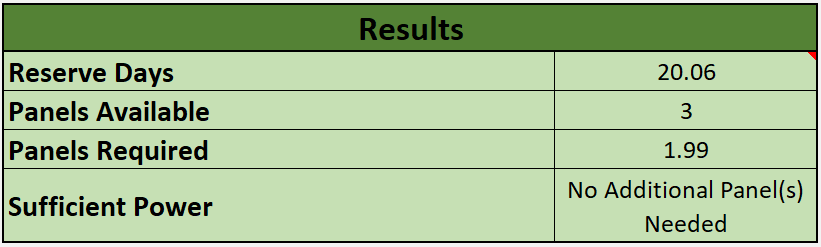
Figure 8: Calculated results display.
-
- Reserve Days refers to how long the system could operate if starting with near 100% battery charge during an extended period without solar charging, or how long a system without any solar charging can be expected to operate. For solar-charged systems, a rule of thumb is to target at least two weeks (14 days) of reserve power.
- Panels Available refers to how many individual panels are available in a solar array. CB-Series buoys normally have three panels on the solar tower. Since their orientation prevents all three from receiving sunlight simultaneously, the power budget accounts for this using efficiency factors built into the calculation. It is therefore not necessary to change this value.
- Panels Required refers to the calculated result for solar charge capacity needed to support the given configuration. It must be less than the Panels Available in order for the system to support the application as defined.
- Sufficient Power provides a yes/no answer for whether the selected hardware, logging and transmit configuration is supportable. If it is not, it displays the theoretical number of additional panels required. Consider adjustments to the system design until achieving a viable result.
Advanced Custom User Entry
Because flexibility for use with user-supplied loggers, batteries, sensors and other electronics is a basic design principle of NexSens CB-Series data buoys, the power budget calculator also facilitates user entry of data for all components.
Besides just the Custom sensor data entry noted in step 3 above, the Custom User Entry tab supports additional inputs. This includes user-supplied data loggers, solar panels, telemetry systems and battery packs. More precise solar insolation for the exact deployment location is also possible.
Activate these fields by selecting the Custom entry option for equipment type, telemetry type, extra battery, sensors, and/or deployment location as illustrated below.
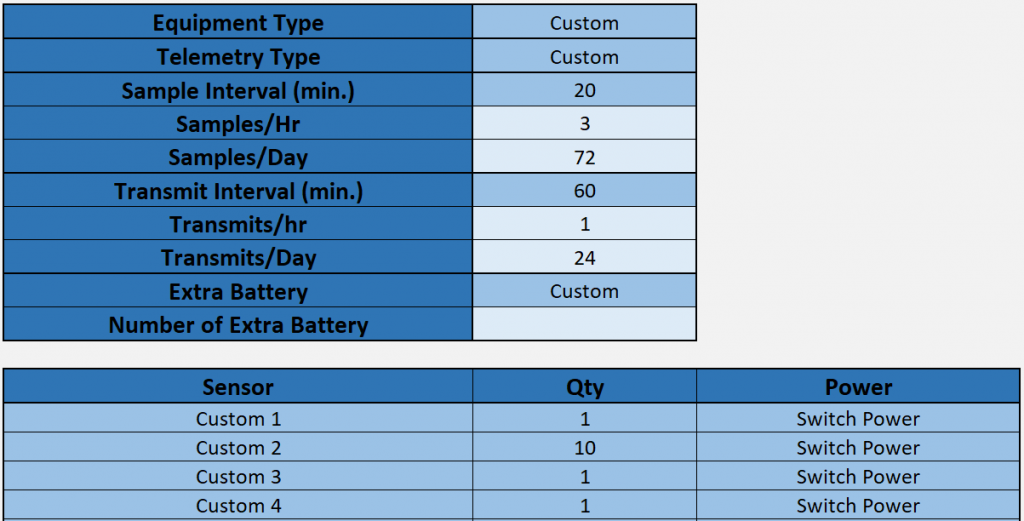
Figure 9: Custom user entry options.
Disclaimer
The NexSens power budget calculator serves as a helping tool for correct system design. It integrates efficiency factors and other conservative estimates of power consumption in order to provide a best possible approximation of system power performance and viability. However, real-world conditions may vary, and field testing is the only way to ensure that a system will perform adequately. NexSens does not assume liability for any system that does not perform in accordance with power budget estimates.