
Dashboard Map Site Marker Colors
Site markers on a WQData LIVE project map will assume one of four possible colors reflecting the current status of the data logger(s) assigned to them:
Green
Green map markers indicate that all data loggers assigned to the site have a normal status. No user-configured alarms or alerts are currently triggered.
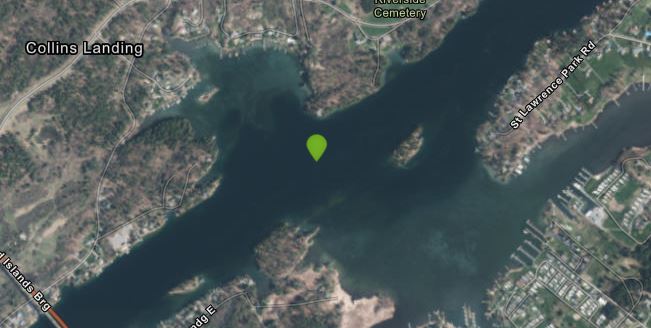
Green site marker indicates ‘All-clear’ or ‘Normal’ status.
Yellow
Yellow map markers indicate that one or more data loggers assigned to the site have an active Alert triggered. One or multiple parameters have exceeded an alert threshold configured by the user on the project.

Yellow map marker indicating an alert condition is triggered for one of the data loggers in the project.
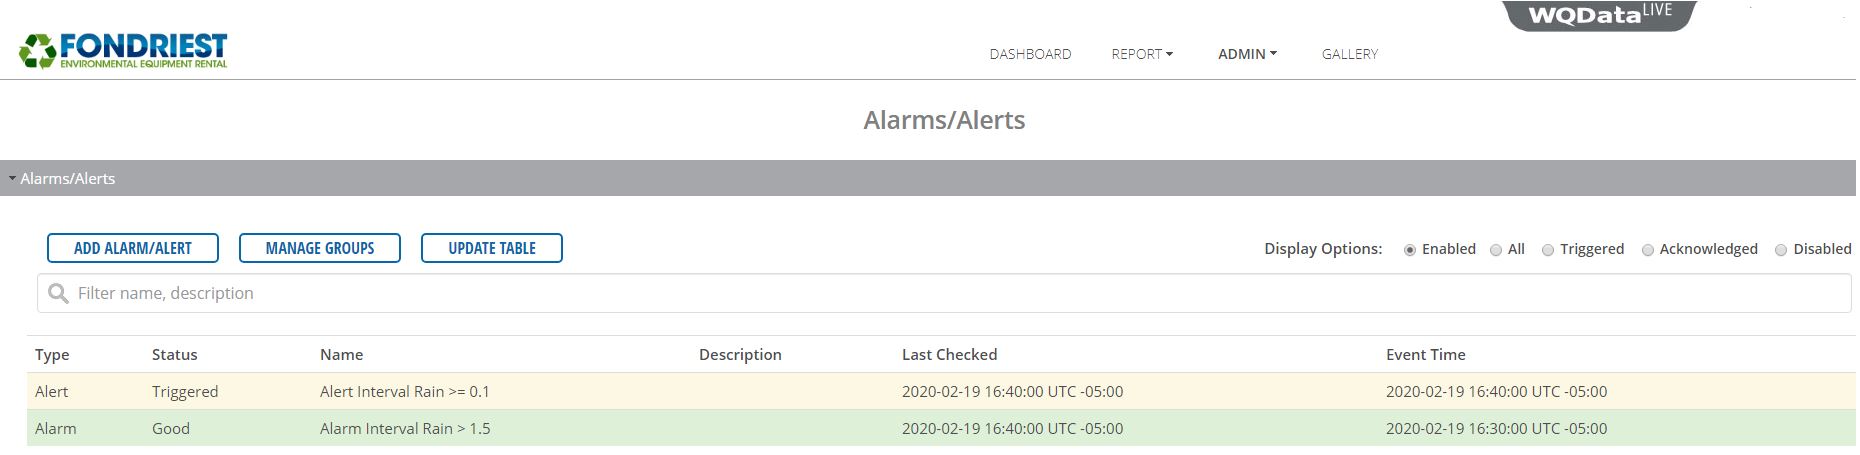
An active alert will show in the Admin|Alarms section of the WQData LIVE project.
Red
Red map markers indicate that one or more data loggers assigned to the site have an active Alarm triggered. Alarm indicators take priority over other status effects (yellow for alerts, gray for disabled) and the map marker will show up red.
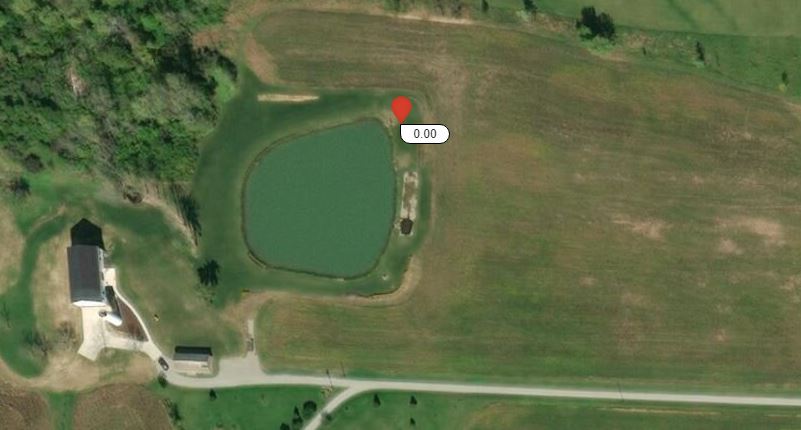
Red map marker indicating an alarm condition is triggered for one of the data loggers in the project.
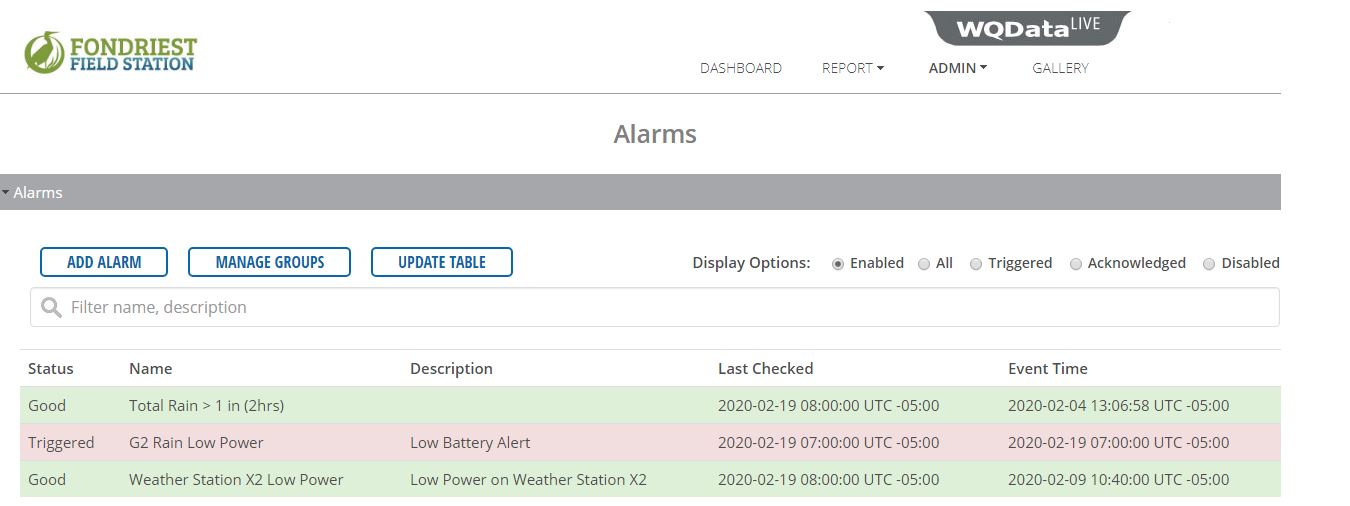
An active alarm will show in the Admin|Alarms section of the WQData LIVE project.
Gray
Grey map markers are presently reserved for legacy iSIC data loggers which rely on the iChart software to upload data to WQData LIVE. If the web upload fails for any reason (no internet on the iChart computer, firewall blocking traffic etc.) or if the site interrogation is manually disabled, the WQData LIVE site marker will automatically turn gray.
Gray map marker indicating the data upload via iChart has failed or interrogation has been disabled.