The Setup Device Wizard allows users to create iChart project files. Users can add new sensors or monitoring sites, as well as remove them. Users should continue through the entire Setup Device Wizard to ensure the iSIC or SDL500 data logger being used is properly programmed. The Setup Device Wizard may be accessed to create a new iChart project file or to make changes to an existing one. To create a new iChart project file, click File | New Project. This will bring up the iChart Users folder. Enter a file name – iChart project files have the extension “.icr” – and click Save.
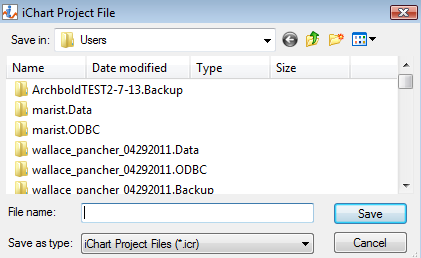
Figure 1: iChart Users Folder
After clicking Save, the Setup Device Wizard will appear.
To make changes to an existing iChart project (.icr), refer to this article on adding devices to an existing project file. Continue for instruction on creating a new iChart project file.
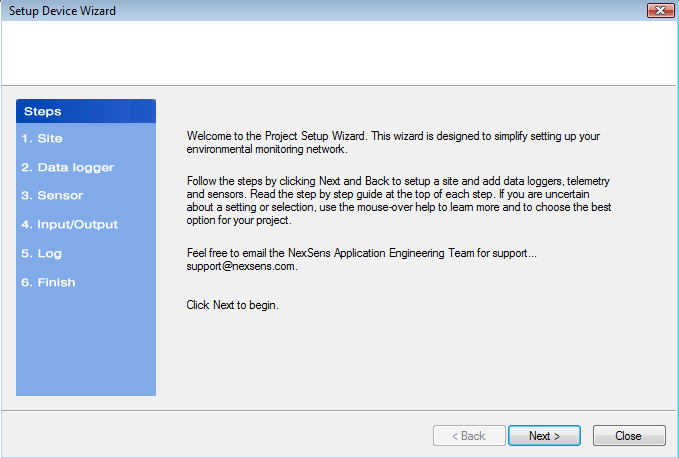
Figure 2: Setup Device Wizard
Step 1 – Site Setup
Click Next to proceed to Site. This step creates a site for data loggers and sensors to be located.
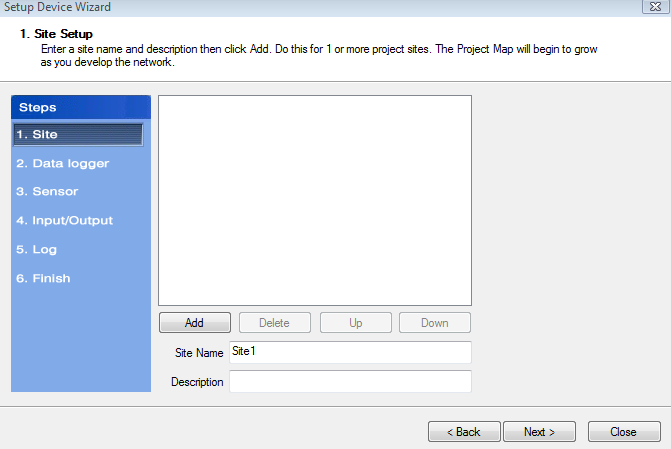
Figure 3: Step 1 in the Setup Device Wizard
Enter a Site Name and click Add. “Site 1” is used here as an example.
Step 2 – Data Logger & Telemetry
The next step is to add the data logger(s) to the site(s) created in Step 1. Select a site to add a data logger to, then select the data logger model number for the list at right. Click Add. “iSIC” is used only as an example.
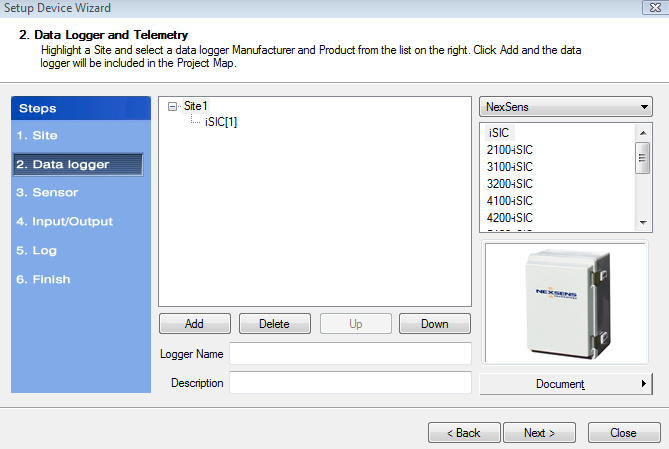
Figure 4: Step 2 of Setup Device Wizard
The iSIC Data Logger Communication Properties window will appear. Enter the connection information and refer to the appropriate iSIC Data Logger or SDL500 sections for specific instruction necessary for adding each data logger to the selected site. When complete, click OK.
Step 3 – Sensor Setup
After adding a data logger, click Next to proceed to Step 3.
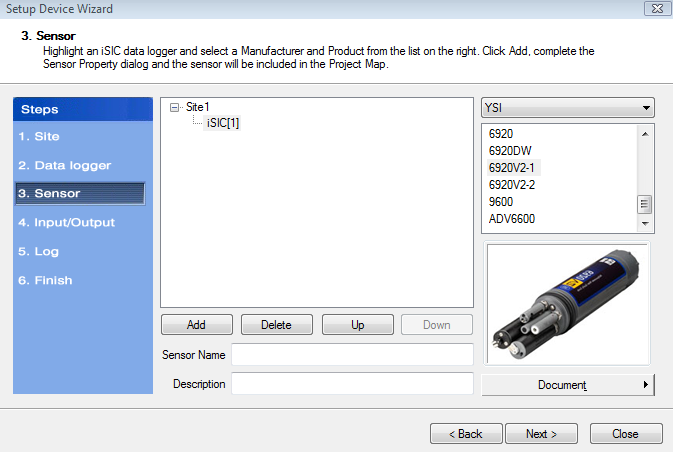
Figure 5: Step 3 of Setup Device Wizard
Select the sensor manufacturer from the drop-down list on the right, then select the model number associated with the device to be added. The NexSens iSIC Battery is used only as an example in Figure 5. Click Add. If the sensor being added does not appear in the list, select Generic as the manufacturer and click on the sensor type.
After clicking Add, the Sensor Properties window will appear.
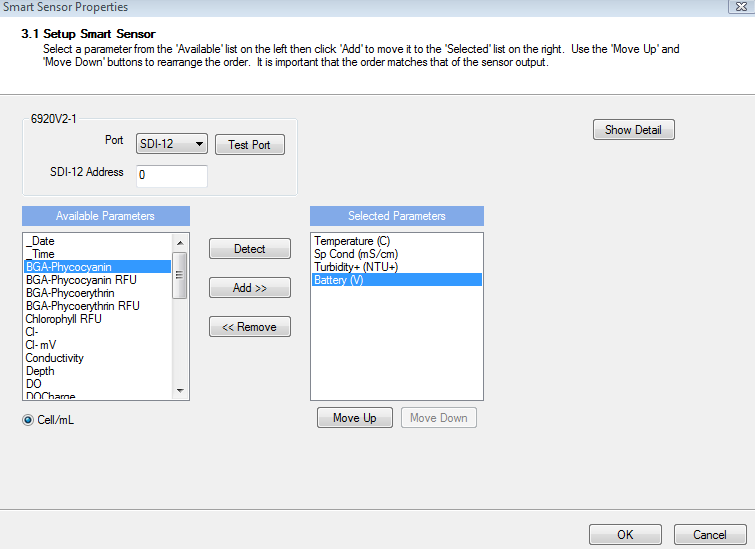
Figure 6: Smart Sensor Properties window
In the example sensor setup above, the Show Detail option is available. It’s not available in the Sensor Properties window for all sensors. When available, clicking Show Detail will display more options.
Click OK and the sensor will be added to the selected data logger. More sensors can be added in this step by selecting the sensor manufacturer and sensor model number from the drop-down menu to the right. When finished adding sensors, click Next to proceed to Step 4.
Step 4 – Output
Output and control features can be enabled in Step 4 of the Setup Device Wizard.
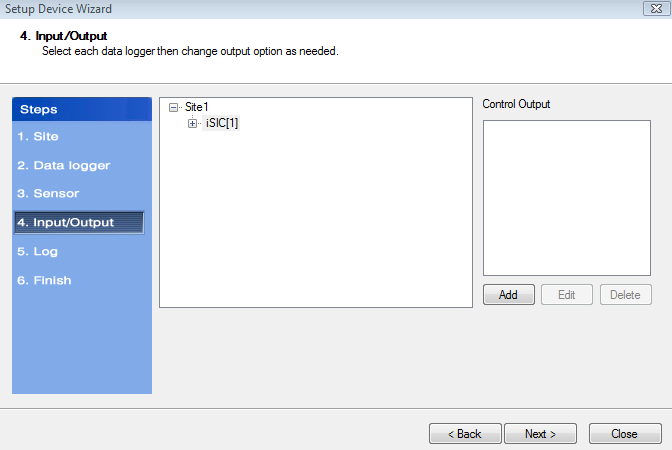
Figure 7: Step 4 of Setup Device Wizard
Click Add to open the Define iSIC Output Control window.
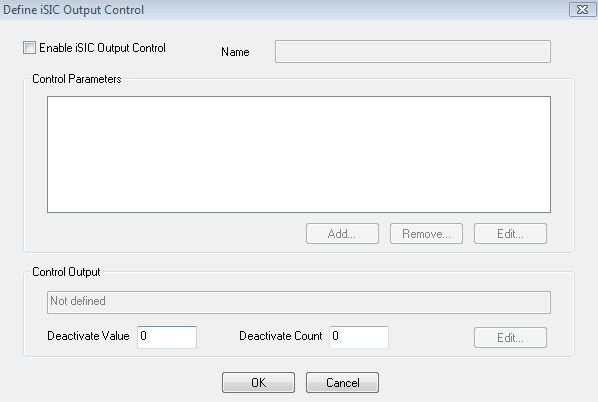
Figure 8: Define iSIC Output Control
Check “Enable iSIC Output Control” and then enter a Name for the Control Output. Click Add to set the output conditions. The iSIC Control Output Condition window will appear.
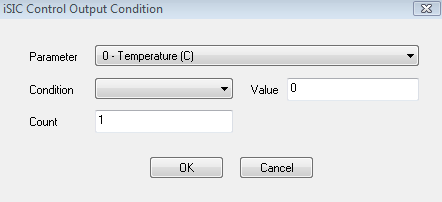
Figure 9: iSIC Control Output Condition window
From the drop-down Parameter list, select the parameter to be monitored. Enter a Control Condition (less-than or greater-than options are available) and enter the desired Value – this is the value of the monitored parameter that will trigger the Control Output. Count is the number of times the parameter will need to reach that Value to cause the trigger. Click OK.
Go to the Control Output Section in the Define iSIC Output Control window and click Edit. The iSIC Control Output Action window will appear.
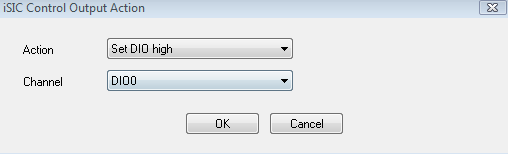
Figure 10: iSIC Control Output Condition window
Select the Action and Channel on which to perform the alarm. The Channel options are either 5V DIO or 12V 100mA switches. Click OK.
Back in the Control Output Section, enter the Deactivate Value and Deactivate Count. The Control Condition will remain active until the Deactivate Value is reached and the Deactivate Count controls how many times the Deactivate Value must be reached to disable the Control Condition. Click OK after personalizing these settings.
Click Next to proceed to Step 5.
Step 5 – Log
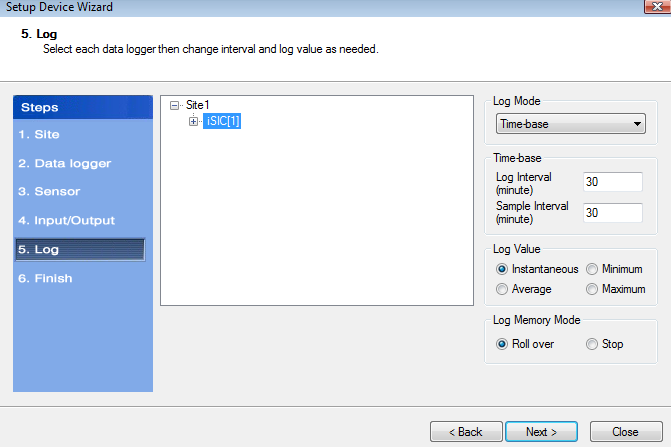
Figure 11: Step 5 of Setup Device Wizard
Log Mode
The Log Mode controls when data is logged by an iSIC. In Time-base (the default and most common), data is logged at a specified interval, controlled in the Time-base section. In Event-base log mode, data is only logged when a ground pulse is sent to the Rain input pin on the iSIC digital terminal strip (such as from the contact closure of a tipping bucket rain gauge).
Log Value
By default, the Sample Interval and Log Interval are equal. When a sampling interval is different than the log interval, all the sampled measurements for the iSIC are used to calculate the average, minimum, or maximum of that logging interval (based on the log type selected, only one can be selected at a time). The individual data points that comprise the samples are not saved; only the final, average, minimum or maximum data point is saved at the specified log interval.
Log Memory Mode
The default memory mode is Roll over, and is the recommended operating mode. In this mode, the last ~150K readings (when using 512K flash) will be stored in iSIC memory. When the iSIC memory has filled with readings it will “roll over” the original readings and keep logging. This is ideal for real-time applications, where data is being uploaded to a PC.
In Stop memory mode, the first ~150K readings (when using 512K flash) will be stored in the iSIC memory. When the iSIC memory has filled with readings, it will stop logging until memory is cleared. When operating in this mode, it is recommended that memory is cleared every time data is uploaded.
After entering the desired settings in Step 5, click Next to proceed to Step 6.
Step 6 – Finish
All data loggers and sensors must be programmed before data collection can begin. Select a data logger and click Program iSIC.
- The standard iSIC must be powered and connected to the computer.
- The 2100-iSIC must be powered and connected to a phone line.
- The 3100-iSIC must be powered and have a cellular data account.
- The 4100-iSIC must be powered and be able to communicate to the computer through a 4100-BASE or 4200-iSIC.
Click Finish when programming is complete. The main instrument control screen will appear. Note that all parameters are initially displayed with blank values until after the first log interval has passed and data has been interrogated. Once data has been retrieved from the iSIC or SDL500, the fields will show the most recent data set recorded. iChart will automatically interrogate devices five minutes after every hour.
REV: 13H03